
There are a variety of tools for generating output including graphs, tables and regression results into Stata. One can export Stata results to different file formats, i.e. Word and Excel. This article focuses on exporting Stata output in Excel for further analysis and reporting purposes.
There exists many commands to export Stata output into Excel, such as outreg2 or estout command. However, these commands are useful for exporting regression results in Excel or Word. The putexcel command, becomes valuable when users want to create custom reports having specific formats. We can also use it when it is required to generate reports on frequently basis. This command allows users to create reports from Stata into Excel and can be used for any kind of result or report for which there is no built-in command or a required specific format. Along with providing a flexible way to export Stata output to Excel, the putexcel command also allows us to specify the formatting of the output in the Excel file.
The putexcel command starts with putexcel set in Stata, followed by the name of the Excel file, in which you want the results to be saved. The putexcel command setting up the environment for the file to be created yet will look something like this
putexcel set results
Remember, the “results” used above is the name of the file, yet to be created. If a file already exists that has the same name as the new file you are going to create, the alternate way is to use the replace option to replace the current file with already available file.
To replace the already existing file with a new file, use the following command
putexcel set results, replace
The newly generated file will replace any previously existing file. You may also create a sheet within the workbook. This worksheet can be named as per choice. If there is already a worksheet by the same name, this worksheet can also be replaced by new worksheet using replace command, as following
putexcel set results, replace sheet( “New Sheet”)
Once the worksheet in Excel file has been set, the next step is to write results or fill Excel sheets. To write the results in Excel file, Stata needs some input to fill Excel cells. Now, we know that Excel worksheet contains rows and columns, where rows are numbered and columns are identified with Alphabets. The intersection of these creates a cell reference, i.e. the first cell of the Excel file is named as A1. Here A stands for first column and 1 for first row. This is the quick revision of basic information, to which everyone is aware of.
Related Article: Using Putexcel to Export Stata results into Excel
Moving on, to fill the Excel cells, using Stata, by required information write the following command
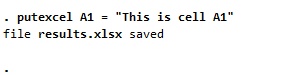
putexcel A1 = “This is cell A1”
“This is cell A1” is the information we are specifying to put into first cell of A1. One can use their own required input to be put into Excel cells.
Stata provides a response that above information in the file named results have been saved.
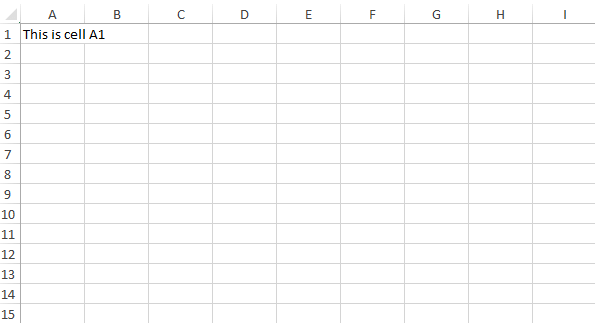
To check whether the newly generated Excel file contains the information provided, we open the Excel file in the directory and cross-check the input in Excel file. It is evident that the given input has been added to the specified Excel cell.
Now we want to use the actual data to perform certain analysis and write those analyses into Excel file. This way we can export Stata output into Excel using actual data. To do so, we use the auto data by importing that data into Stata. The imported auto data has different variables including car price, where it is manufactured, weight and make of the car etc.
sysuse auto.dta, clear
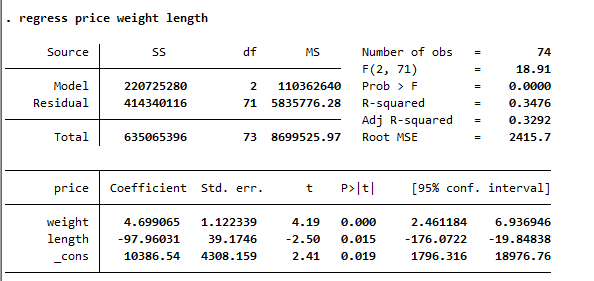
Regressing price on weight and length by using following command,
regress price weight length
We get the following regression results
In Stata, scalars,macro’s and matrices are different type of variables. A scalar is a single numeric value that can be used to store a single result or value of a calculation. A macro in Stata refers to a single observation or unit of analysis, typically represented as a row in a dataset. Matrices, on the other hand, can store multiple numbers or strings. Matrices can be manipulated and analysed using Stata’s matrix commands.
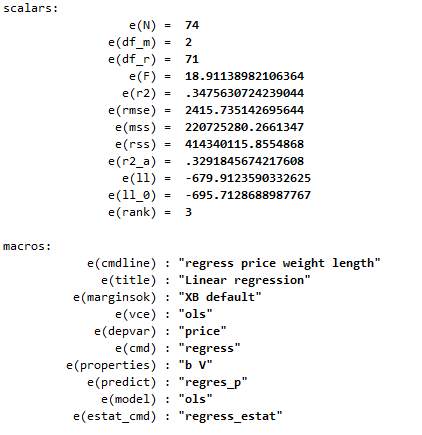
To access the scalars, macros, and matrices that store coefficients and other variables, we use the following command
ereturn list
The following results are displayed, showing scalars and matrices saved in the Stata.
Certain Matrices are also shown from the results generated by the above command.
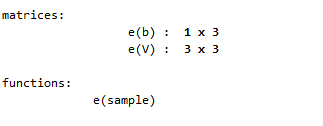
We are particularly interested in the first matrix, which has 1 by 3 order. The matrix shows the coefficients in the above regression results. The coefficients are weight, length and constant. To access these coefficients, one can use the matrix command followed by the name of the matrix where the coefficients are stored. The results can then be stored in a new matrix using the apostrophe sign. We use the following command for the above function
matrix b = e(b)’
Although Stata results window shows no specific results , it has created a matrix named b in its memory. Now, we again want to use the putexcel command to export Stata output and save results in Excel, as we did earlier. However, instead of saving results in A1 cell, we wish to save results in A2 cell. The desired result needed to put into A2 cell is the matrix b we created above. To specify the Stata about putting matrix b in cell A2, we use the following command
putexcel A2 = matrix(b), rownames, nformat(number_d2)
In the above command, we specified Stata that results should be saved in the A2 cell, so the first entry of matrix is saved in A2 cell. It occupied other cells too (as shown in the Excel results file below) because matrix’s capacity is greater than 1 cell.
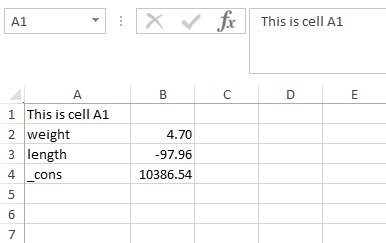
Likewise, to include the row names in the Excel file, the “row name” option is used. Row names in the command represent the variable names in regression coefficients, i.e. weight, length and constant. Additionally, the nformat(number_d2) option is used to limit the number of decimal points to two in regression results. Other options including column names or names are also available other than row names. Using the only “names” option will provide both column and row names in the Excel file. To demonstrate it further, close the Excel file, and re-run the above used command, but now using names option instead of row names.
putexcel A2 = matrix(b), names nformat(number_d2)
Once the command is executed, the excel file shows both row and column names in the results, as shown below
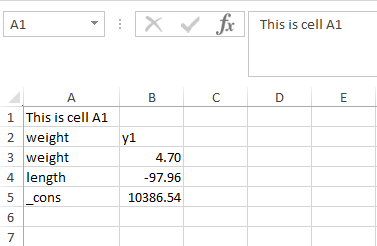
The Y1 in the above image doesn’t clarify what it is referring to. As our dependent variable is price in the regression, the Y1 should be replaced with Price. This can be done by renaming the column, and naming it Price. For this purpose, we use the following command
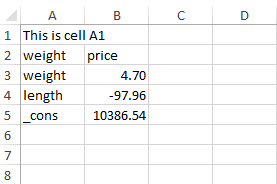
matrix colnames b = “prices”
Once this command is executed, the putexcel command will be executed again to save the results in the excel file.
putexcel A2 = matrix(b), names nformat(number_d2)
Once this command is executed, the results in Excel file will be as follows, where column name is replaced with Price
Remember that while using the above command, excel file should be closed, and not running in the background. If the excel file, however, remains open in the window and the above command is executed, Stata will give the following error.
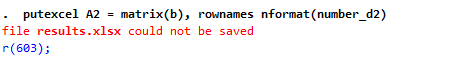
To avoid this error, one should close the excel file and then execute the above command.
Related Article: How To Make Heatplot In Stata | Correlation Heat Plot
Modify Option
Let’s consider modifying an already existing Excel file. By using the putexcel command with the name of any already existing file, Stata would give an error showing that the file already exists. Stata provides a solution that you can either modify or replace the file.
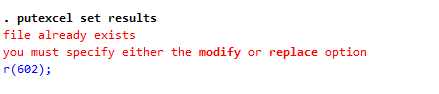
This way, one can export Stata output into Excel while modifying or replacing the Excel file. However, we don’t want to replace the file because results present in that file are important. Thus, we move forward to the second option available, that is modify option. To use the second option and modify the file, we need to specify the aspects we want to change, keeping rest of the data intact. To modify a file, use the following command in Stata
putexcel set results, modify
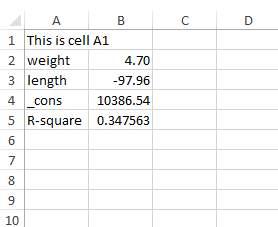
Now while modifying files, for instance, let’s say we want to write the word R-square in the A5 cell in Excel. Also, we want to write the actual value of R-square, that is present in e(r2) in scalars above, in B5 cell in Excel. To specify Stata about the above instructions, we use the following two commands
putexcel A5="R-square" putexcel B5=`e(r2)'
Don’t forget to use the inverted commas and apostrophe sign in the commands, to avoid any error from the Stata.
Once these commands are executed, the Excel file has been modified and shows the R-square values.
Change Formatting of the Excel File:
Putexcel command can also format Excel file, where header can be added to a table, making table look like an actual table, along with many other options available. To create a table, the range of the table, where values will be added, is also selected. We select the range in Excel file by adding a colon sign (:).
To select a range, say a range starting from A1 to B1, and add a header in this range, we use the following command
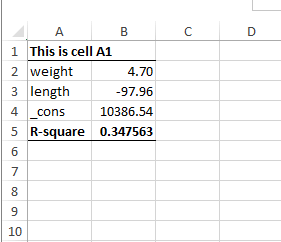
putexcel (A1:B1), bold border (bottom)
This command will change the formatting of cells ranging from A1 to B1 and draw a bold bottom line below these cells, as specified by the command.
Similarly, if we want to have a border line below any other cells too, the cell names will be specified with the same command used previously. For instance, we use following command to change add border line below A5 to B5 cells
putexcel (A5:B5), bold border (bottom)
Adding Images in the Excel:
When we export Stata Output to Excel, many options available in Excel can be utilized. As Excel has numerous functions, ready to be utilized, one can also add images or graphs in the required Excel files using Stata.
To add a bar chart in the file for, say the price variable over the categories of car whether it is manufactured domestically or in foreign country, we either follow the manual procedure through following path
Or, a simple command can also be used to add the bar chart for the prices of these categories. The command for adding bar chart is
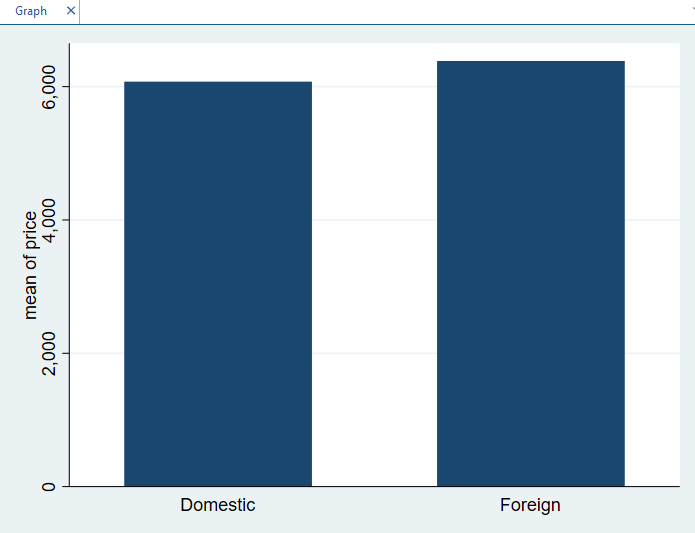
graph bar (mean) price, over (foreign)
The following bar chart will be created, where prices of domestic and foreign cars are displayed in bars. These bar charts can be edited and formatted as per requirements.
Now that bar chart has been created, one wishes to export this bar chart in form of PNG file. Stata allows users to export the charts they have created in any format, where name of the chart can be edited as desired. We use the following command to export this bar chart in form of PNG file
graph export "bargraph.png", as(png) name("Graph")Moving forward, once the graph has been saved in form of png file in computer, this graph can be added to Excel file too. It’s interesting to note that Stata has many built-in options that, which can be used to export Stata output to other software and can ease a task by simply typing a command and not going through manual hustle. The graph that we generated can be added into Excel file, in any cell, where we want it to be added.
We use the following command to add graph in G2 cell of the Excel file
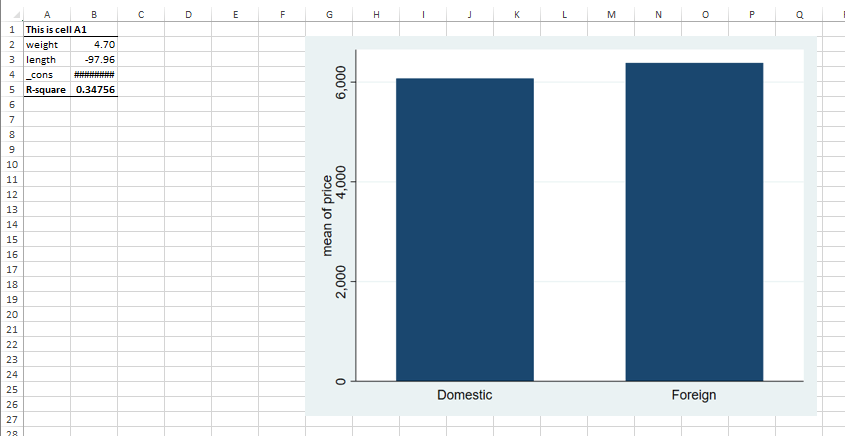
putexcel G2 = image(bargraph.png)
The chart will be added to the G2 cell in Excel.
Similarly, other formatting options are also available to format Excel files. Using these options, one can change the font style, size and colour in the Excel file. For instance, if the requirement says that text present in A2 to A5 cell should be bold italic font in Arial style with 13 font size and in Black colour, we use the following command to specify Stata about this formatting
putexcel A2:A5, bold italic font("Arial", 13, "black")The formatting of the text in Excel file has been changed. However, if we want this whole table to be converted into a nice table, and the header of the table to be merged, this command will be used which will specify Stata what kind of table is required to be generated
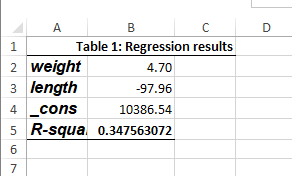
putexcel A1:C1 = "Table 1: Regression results", right merge
Once the command is run, the table is updated in Excel.
Adding dates in Excel File:
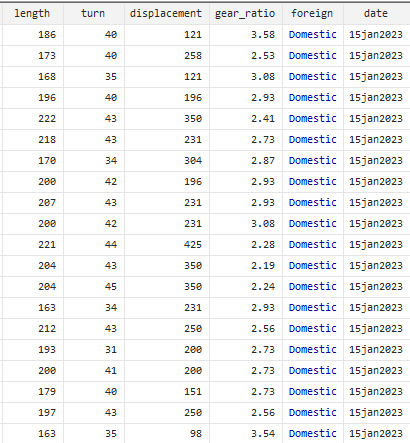
Date can also be added in Excel file by generating a variable named date in the Stata. The date one is interested in generating can have different formats, i.e. DMY, YMD etc. To generate a date variable, this command will be used
gen date=date("15/01/2023","DMY")The date variable generated has order of Date, Month and Year, denoted as DMY. We need to specify Stata that what kind of order is to be specified to date variable we are about to generate. This date order can also be formatted in Stata.
If we format the date in Stata by using %td command, it will change the date to daily date, and it represents dates as the number of days.
format date %td
The dates formatted using %td command will be shows as follows in Stata
However, this date variable, if exported to Excel file, will not be human-readable, but only machine-readable.
To visualize this, let’s clear the previous Excel file and generate a new Excel file with the same name using replace option
putexcel set results, replace
Now, use the following command to add date into A1 cell of Excel file.
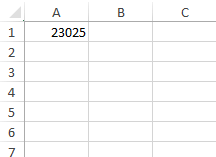
putexcel A1 = date
However, the date saved in Excel file, is just a number, not differentiating which one is day, month and year in the date.
To get a date, that actually looks like date, we use the command given below to specify what kind of date is required to be generated
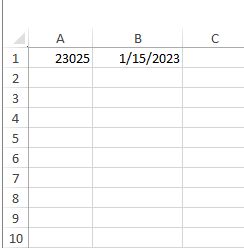
putexcel B1 = date,asdate
Now the date generated is understandable, and we can differentiate between day, month and year in date.
Now the date generated above is generated through the date variable, but if one wants to generate specific date for a specific task or report, it can also be done in the Stata. However, if we simply write the date and the cell number in Excel, where the date is required it would be shown as number, as it did previously. For instance, the date you want to write is 15/01/2023 in C1 cell. If you write the following command
putexcel C1 = "15/01/2023"
It would be shown in the text format and not in date format. To access the formatting options for date, it is necessary that date should be in date format and not in text format.
To add date in date format in Excel, use the following command
putexcel D1 = (date("15/01/2023","DMY")),asdateNow the date is saved in date format, and it could be formatted according to requirement in the Excel.
Save Excel File
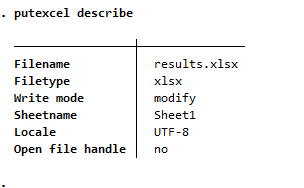
To export Stata output to Excel, the Excel file we worked on can saved in the Stata upon providing relevant instructions. The file can also be described to get information about the file. To describe an Excel file, the following command should be used
putexcel describe
Stata will describe the Excel file by providing its name, file type and other features as well.
Similarly, if we wish to save the Excel file, it can also be saved with all the changes in it, by using following command
putexcel save
The excel file has been saved.