
This article gives a comprehensive overview of three Stata commands from the estout package that are used to output publication style correlation table in . Though this package is capable of reporting outputs for regression results and summary statistics as well, it is particularly useful for outputting correlation tables too. If you want to understand the basic concept related to correlation, please head on to Chapter 8 of A Gentle Introduction to Stata by Alan C. Acock.
Download Example FileIf have not already done so, you can install the estout package to your Stata through the following command
ssc install estout
For this article, we once again make use of the Stata’s 1978 Automobile dataset.
sysuse auto.dta, clear
estout
To output the correlation table we need to follow two steps:
- Run estpost to estimate the correlation matrix,
- Output the correlation table in a presentable way.
1. Run estpost to estimate the correlation matrix
correlate price mpg rep78
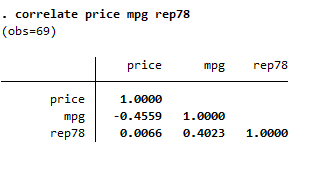
The command above displays a simple correlation table for the specified variables. The table includes correlations of each of the three variables with each other, i.e. ‘price’ with ‘mpg’, ‘price’ with ‘rep78’, and ‘mpg’ with ‘rep78’.
estpost correlate price mpg rep78
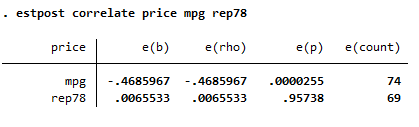
Adding estpost at the start of our previous commands returns us a different table with two rows and four columns. This command creates a table that shows the correlation between only the first two variables in the command. So in this case, it will report the correlation between ‘price’ and ‘mpg’. To include correlations between all three variables (or any number of variables), we add the option of matrix to our command.
estpost correlate price mpg rep78, matrix
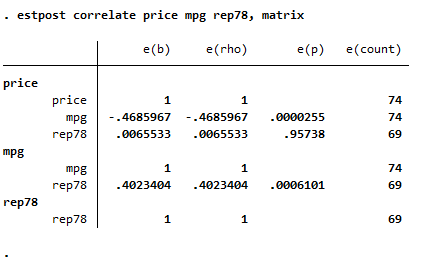
We now get a table with correlations between all three variables reported. The matrix option helps report correlations of all possible pairwise combinations of the variables in our command. The reason we still see a difference between the correlation values in this table and the one reported by correlate is because the estpost command does not omit missing values when calculating correlations.
However, not all variables that we calculate correlations of have an equal number of observations. In our example, ‘price’ and ‘mpg’ have 74 observations, while ‘rep78’ has 69 (5 missing values).
In order to account for such missing values in the dataset, and ensure that the estout command only calculates a correlation matrix from non-missing values for all observations, we make use of the listwise option along with matrix.
estpost correlate price mpg rep78, matrix listwise
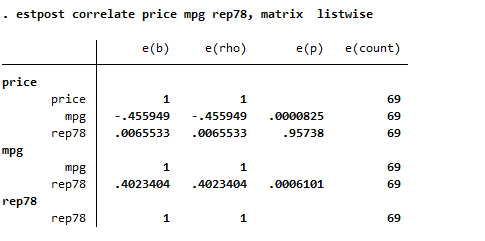
The column for the number of observations, e(count), should now show a consistent figure throughout the table.
[embedyt] https://www.youtube.com/watch?v=St6qDmvBI08[/embedyt]2. Output the correlation table in a presentable way
esttab using results.rtf, replace
The syntax, though similar to outreg2, eliminates the need to specify an option for the output file type and accounts for that within the file name through an extension, .rtf in this case.
‘Long’ to ‘Wide’ Format of the Table
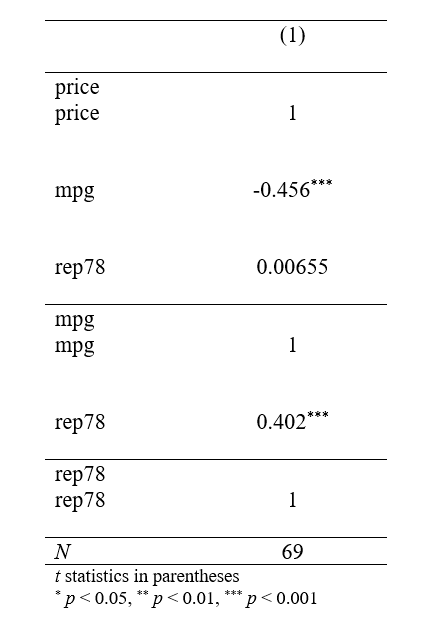
Because this basic syntax reports the correlation data in one column, we make it more readable and presentable by adding the unstack option to display the correlations in a ‘wide’ format.
esttab using results.rtf, replace unstack
Removing Empty Rows
The additional rows in the table, otherwise place holders for standard errors which are not available here, can be removed by the straightforward not option:
esttab using results.rtf, replace unstack not
Removing Number of Observations and Notes
To omit the the number of observations from the bottom of the table, we further add an option of noobs:
esttab using results.rtf, replace unstack not noobs
To remove the note on significance levels at the bottom of the table, we also add an option of nonote:
esttab using results.rtf, replace unstack not noobs nonote
Related Article: Using Putexcel to Export Stata results into Excel
Adjusting Decimal Places
We can make the number of decimal places consistent throughout the table by specifying a number in the b() option. In this example, we limit our table to report correlations up to two decimal places:
esttab using results.rtf, replace unstack not noobs nonote b(2)
Reporting Labels Instead of Variable Names
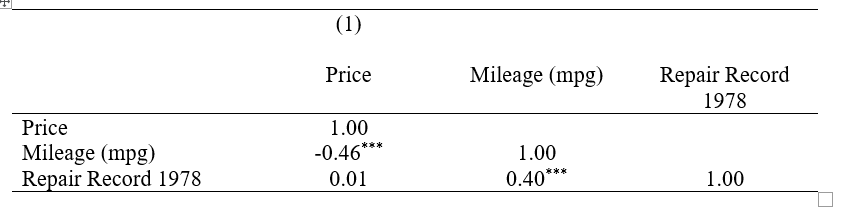
In order to report label names instead of variable names in our correlation table, the option of label does the trick:
esttab using results.rtf, replace unstack not noobs nonote b(2) label
To output the same table in Excel, we run the estpost and esttab command as follows:
estpost correlate price mpg rep78, matrix listwise esttab using correlationresults.csv, replace unstack not noobs compress b(2) nonote label
Simple changing the file extension from.rtf to .csv saves it in Excel format. In addition, the compress option reduces unnecessary horizontal spacing.
The steps above should now leave you with a neat, publication-worthy correlation table for use in formal academic papers.
For more details on estout command click here.