We are going to work on the ‘Putexcel menu’ to help export Stata Results into MS Excel. In Stata,we can run the functions to get desired results either using command or using the menus. Many users prefer using the menus because it is easier to use when you are getting used to them. Using menu can also familiarize you with the command. In our previous artile we explored the putexcel using command however, in this article would help you use the Putexcel menu from the menu window to get desired results.
First, you are going to set your Current Directory as the Putexcel folder. This can be done by clicking on the file and on ‘Change working directory’. Then select whichever directory you want to store your files in, you can save the Excel file in any of the working directory there is.
File > Change Working Directory > Preferable Directory
This can also be done using the following command, where working directory can be changed as follows
cd "D:\putexcel"
You can find the current working directory down below in the left-hand corner. For instance, if one’s current directory is ‘C User documents’ they can change it to ‘D Putexcel’. So, whatever Excel file one would save, it would go to the ‘D Putexcel’ File folder.
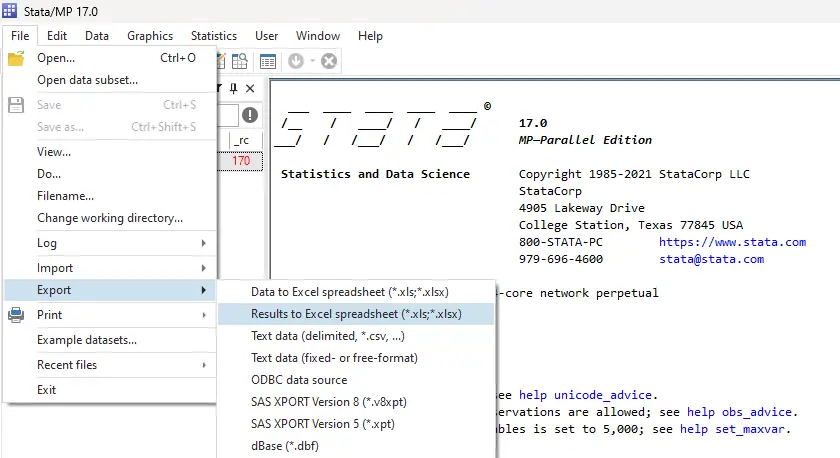
Starting with the menu to use putexcel menu, we first click on the ‘file’ then ‘export’, then to the ‘Excel spreadsheet’ and you will see that we have Putexcel Command.
In the following window that appears, we have four different options for using putexcel menu. These include setting either a worksheet, exporting the results, describing the current export setting, or clearing the current export setting.
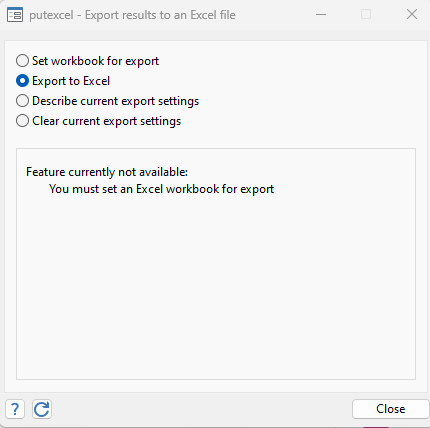
Remember, if you want to work with all of these options on putexcel given above, you first need to set up an Excel file. For instance. If you click on ‘Export the file’, Stata would suggest the same thing i.e., to set an Excel File, for this command to work.
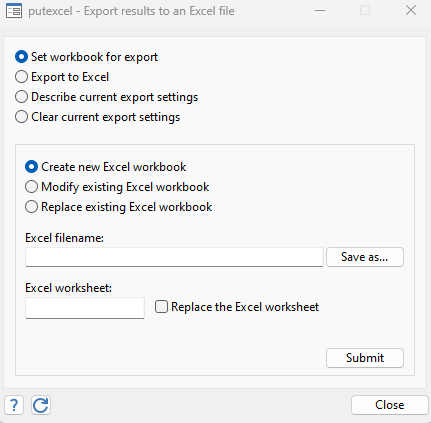
Now, we can either create a new Excel workbook, modify an existing one or replace an existing Excel Workbook. For instance, if you do not have an Excel sheet created, you will create a new Excel sheet. You will have to name the worksheet in ‘Excel Filename’ and you can also have a new worksheet within that. When you are done with the inputs, clicking on ‘submit’ would set that Excel Sheet.
Keep in mind, it would not create the file, you can see that in the Working Directory, but the environment is just set so whatever is exported, would go to this ‘result’ Excel file. Thus, you need to go to the ‘Export Results’ and click on ‘Create’. On this window, you create the expression of where do you want to save the result. So let us bring in an empty Excel file.
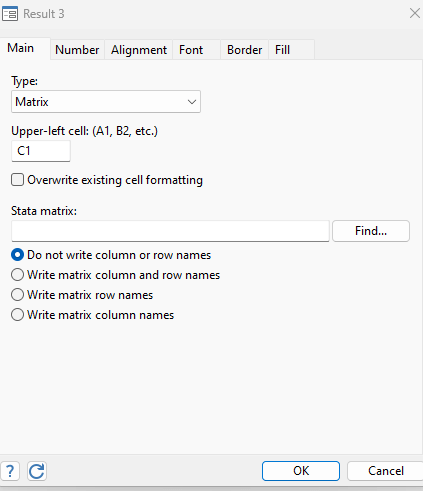
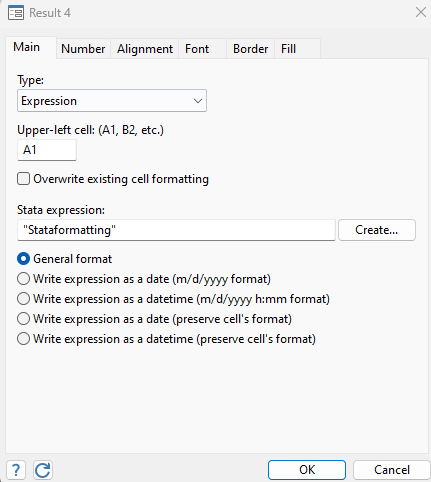
We know that in Excel we have columns, and they are named as the Alphabets. Similarly, we have rows that are numbered. With the intersection of the column and rows, we can have a cell reference that is named by its column and row. So, a specific cell, shown below, would be called B2. We need to understand what a cell would be called, as it would be helpful in moving forward. Now, we are going to write in the box about the reference of the cell, which would tell the software about the specific cell we want our data to go in.
Suppose you chose A1, you will subsequently have to choose the ‘Stata Expression’ and write whatever expression you want. For example, you want to write ‘This is cell A1’. Once you are done writing, you will select ‘OK’ and then click ‘Submit’.
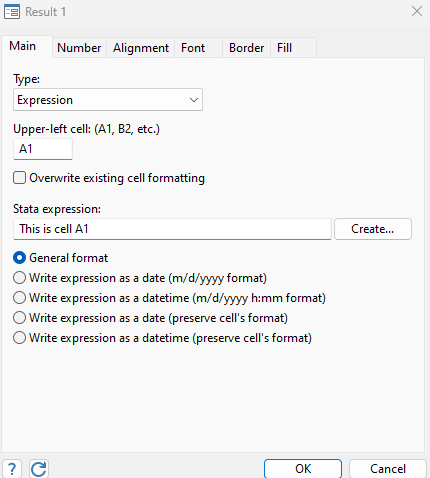
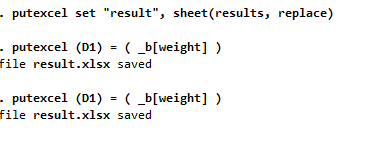
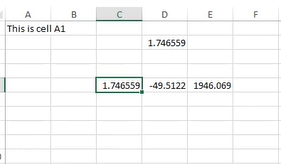
It would show that the file results are saved in Excel. Now, if you go to your working directory, you can see the saved Excel File with the specific data in cell A1. So whatever data you would choose, it would be exported to Excel.
Moving forward from the basic example, why not work on a more complex and rigorous exercise for the sake of learning? How about learning to import some data? You need to import the data using following command
sysuse auto.dta
This would show the Auto data that contains different variables. These variables include the price, the make, the mileage of different cars and their weight and length, etc. Let us regress price on weight and MPG, for instance. Always remember, the results are saved in certain scalar matrices or macros. If you are not familiar with what either of those is, you can guide yourself to one of the previous articles on scalers and macros.
We can access the saved results, in macros and scalar matrices, through following command
ereturn list
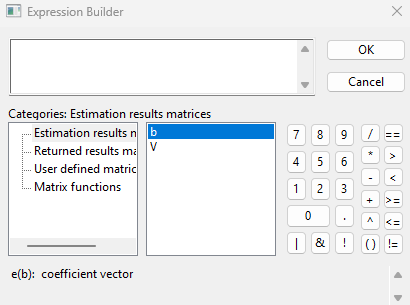
The command tells us the number of observations that are stored in a specific macro ‘e(N)’, and the R2 stored in this specific macro by ‘e(R2)’ that you can compare. Similarly, there would be matrixes down below, for the coefficients. If we have 3 coefficients, it will show a vector of 1×3. So, if you want to get these coefficients, we would create a new input. Let us save the data in D2 this time, and as we want to access the coefficients, we can click on ‘create’. This will create the expression.
Now if you see in the table, you can see the coefficients, clicking on the coefficients we can get the variable that we have. For example, let us say we want to access the coefficient of weight. For that, we are going to select weight in the sub-table of coefficient, click ‘OK’ and ‘submit’.
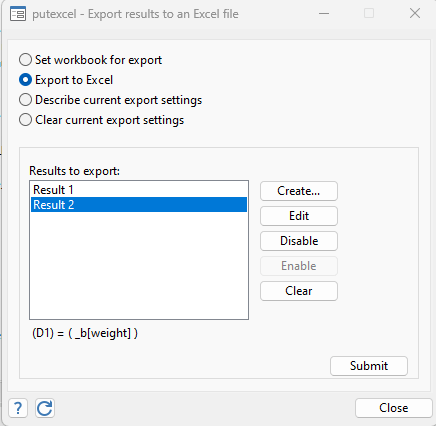
You will notice that each time you click ‘submit’, it would execute all the values and commands that are shown. This means that it would export ‘Result 1’, ‘Result 2’, and all other results you may have.
If you do not want that to happen, and you only want results of the current export of results, you can simply click ‘disable’ to disable the result you do not want to be shown. Subsequently, it would only perform the command that is not disabled. This will make the execution of the command limited. However, whatever results were there on the Excel sheet, would remain unchanged.
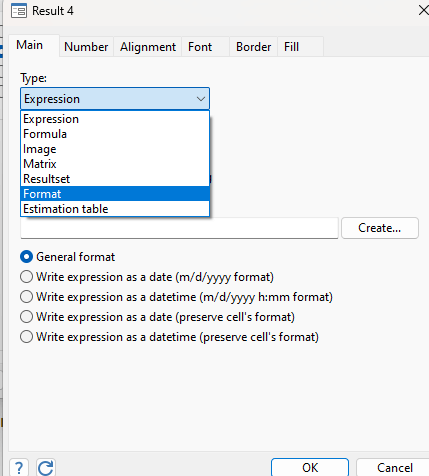
Moving forward, we can have several different options to export; we can create an expression, we can have an image, we can access matrixes, we can add result sets, we can format, we can make an estimation table, or we can send a formula into Excel that would not be represented as a text but rather as a formula. Let us work on a matrix this time.
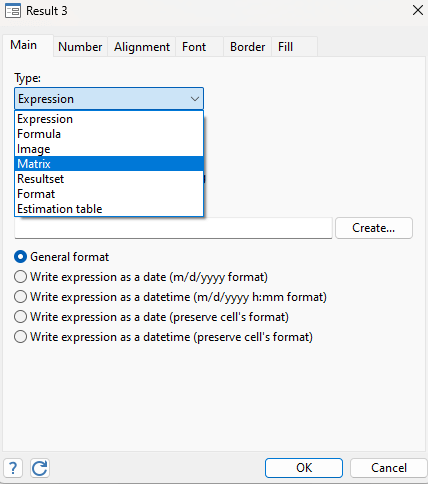
Let’s choose the C1 cell to add the data. In Matrix, we can click on ‘find’ and that can provide us with a matrix for every result that we did.
For our specific example, we have data stored in this ‘b Matrix’. If you want to access the matrix, you will work in the following direction. Firstly, you will have to select b matrix and click ‘OK’ and ‘submit’. This will execute the command.
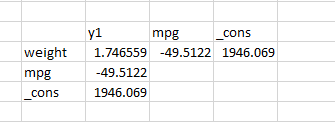
By looking at the Excel file, you will see all the values from b Matrix, representing the coefficients of weight mileage and the constant.
If you feel that the data needs some substantial standing, and you want to add the names of columns and rows, you have to click on ‘Result’. In there, you can see how, by default, your columns or rows would not be named. Along with the default, there would be three other options; we can either the Matrix column and row name, we can write the matrix row name, or we can write the matrix column name. Let’s stick with both row and column names.
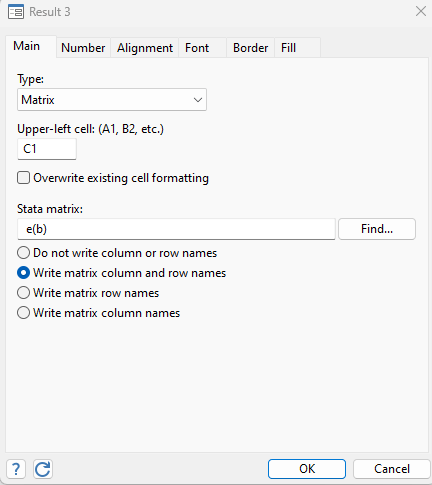
If you open the Excel file after submitting the result, you will find the Matrix of weight, mileage, and constant in the assigned cells. We can also change this up by changing the expression and writing the dependent variable name. Remember, whenever we are going to execute a command, and we are going to ‘Submit’ the command, we need to close the currently opened Excel file. If it is already opened, the command will not save the result file and it will show an error.
We can also convert a specific Matrix. If you want the variable names into columns instead of rows. To do so, let’s first delete the previously existing Excel file, and submit the following to generate a new file
putexcel (C5)= matrix(e (b) ), names
However, if you want to convert rows into columns, add an apostrophe in the command, as given below. This would transpose that matrix.
putexcel (C5)= matrix(e (b)' ), names
This would transpose the matrix in Excel as shown below
We can also do some formatting to the data i.e. we can align the data horizontally or vertically, can wrap the text If you have certain dates that you want to export, you can use the ‘date’ option. We can also merge certain cells, but that would only work if we have selected a range of cells.
For example, If you want to merge certain cells, we can start by creating a new file. The expression type would be ‘Format’.
Selecting ‘Format’ would lead you to your selection of the range of cells that you want to merge.
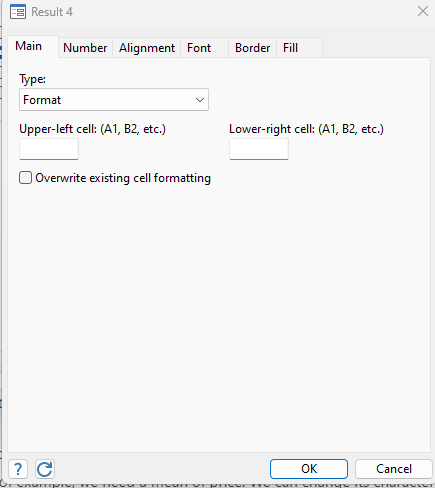
If you are merging from A1 to B1, you would put the range in the boxes, and then you would click on ‘alignment’. Here you would see an option of ‘merge cells’.
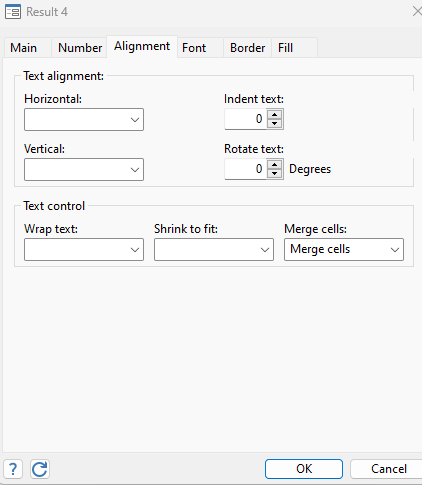
Click ‘Submit’ and go to the Excel file. Here you can see that the specific range of cells you selected was merged.
If you want to put certain text in the Excel file, you need to create a new expression for that. Select ‘Expression’, input cell ‘A1’ and write your desired text and that would land in the merged text. However, remember when you are working with a text in merged cells, you should use inverted commas to make it work. Otherwise, the command would give an error and your work will go to waste.
You can set a border, and change the style and colour of the border. You can fill a cell with certain colours or do images. There are a lot of options, go wild with it!
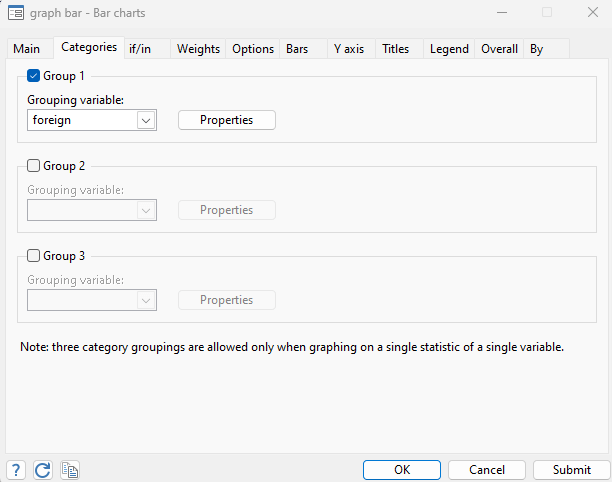
Do you want to create a graph? We got you covered! If you have to create one, let’s say a bar chart, find ‘graphics’ in the toolbar and ‘bar chart’ in the graphics. For instance, we need a mean of price. We can change its characteristics, for example, the bar should be categorized based on whether a car is foreign or a local one.
Once we are done customizing, we can save the file in our working directory. Remember to save it as an image in the ‘PNG format’ rather than the Stata’s default ‘GPH format’. It would be named ‘Graph.png’. We can copy the name of the graph that is saved and export that graph into Excel Sheet as ‘Result to Excel Sheet’.
To save the graph in the Excel sheet, create a new expression and change the type to ‘Image’. You can save it in a cell you want, and you can put the name of the file in the box below.
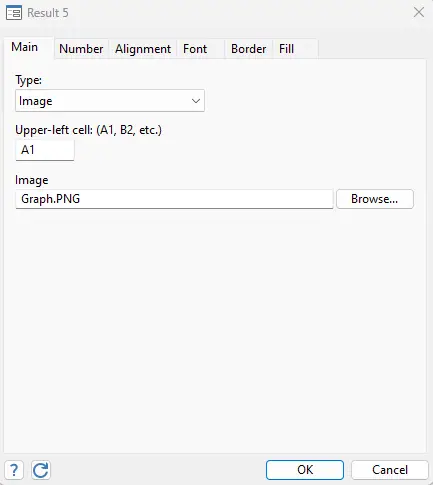
Once you click ‘Submit’ and open the Excel Sheet, you will see your graph pasted in your desired cell.
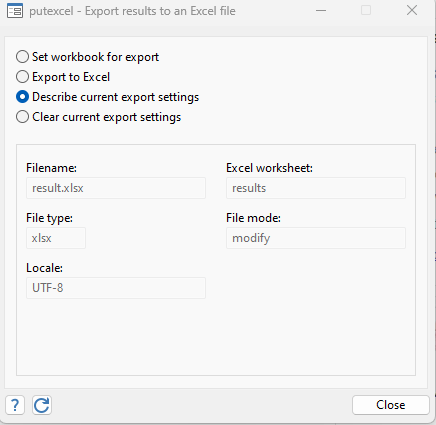
If you want to look into the file that you are currently working with, you can click on ‘describe current export settings’ and it would show you the details regarding the file, the mode we are in etcetera. You can also clear the current settings. It would not delete the file from your hard drive, but it would empty the file setting from our current version of the status. Remember that you cannot change anything in the file setting, it will just tell you the details.