
The main difficulty that many researchers face in asset pricing models is replicating the factors in different software such as Stata because it would be very time-consuming to gather all the necessary codes and test whether they function appropriately and there are lots of researchers who never had experience with analytical software, therefore you can save time for further steps in your studies and make sure that you will earn correct results if you use our provided codes in the Stata, which is proven by our experts. These codes include all calculations related to SMB and HML factors, as well as constructing portfolios. This code is specifically written for CRSP and COMPUSTAT data and dummy data is also provided. Further, this code can easily be modified to work with other datasets, or feel free to contact us.
Cleaning stock return data
This code first cleans the stock return data. The File “msenames_final.dta” from CRSP contains the stock identification information such as permno (Permanent Identification Number), exchcd (Exchange Code), shrcd (Share Code), siccd (Standard Industrial Classification Code), namedt (Name Effective Date), nameendt (Last Date of Name), which will be merged with the File “msf.dta”, that contains stock returns. We have also filtered our data, for example, we needed only share codes of 10 and 11.
Delisted Stock Return Adjustment
This code takes care of delisted stock and adjust the return with respect to delisted stocks e.g. we assigned a negative 30% return to observations where dlstcd is either 500, 520, between 551 and 574 both inclusive, 580 or 584. This treatment is based on the Empirical Asset Pricing Book by Bali and Shumway (1997) and (Shumway, T. 1997. The delisting bias in CRSP data. Journal of Finance, 52(1), 327–340.)
Compustat Database
We collected the necessary data from Compustat database for calculating the factors in the Fama and French model. These data are gvkey (Global Vantage Key), datadate (end of the fiscal year), seq (Shareholders Equity), ceq (Common Equity). Pstk (Preferred stock total), pstkl (Preffered stock liquidating value), pstkrv (Preffered stock redemption value), AT (Total assets), LT (Total liabilities), txditc (Deferred income taxes (txdb), and investment tax credit (itcb)). We calculated the book equity according to the following formula which you can find in the paper of Fama and French in 1993:
book equity (be) = Shareholders equity (seq) + deferred tax (txdb) + book value of preferred stock (bps)
Connecting CRSP and Compustat
In the next step, we merged the CRSP and Compustat databases, because each of them has different data that is needed in the study. Merging these two files is very difficult because the same stocks in these stocks have different common identifiers (CRSP has permno and Compustat has gvkey as an identifier). There are two methods to merge these files: 1- Using “cusip” code and 2- Using CRSP/Compustat merged database (ccmxpf_linktable). We used the second method for several reasons: 1- CRSP and Compustat use different approaches to keep cusip records, and 2- the second method is more popular because the first method has some shortcomings.
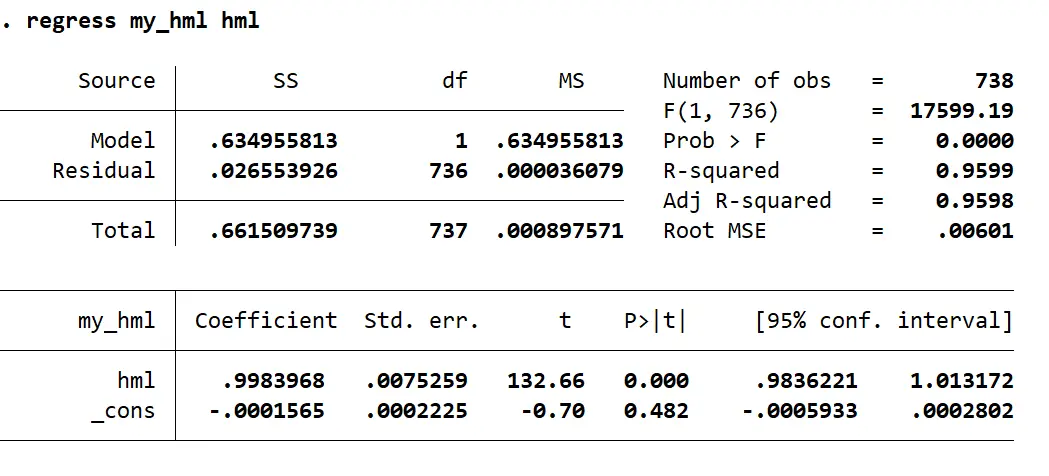
Replicating Fama and French
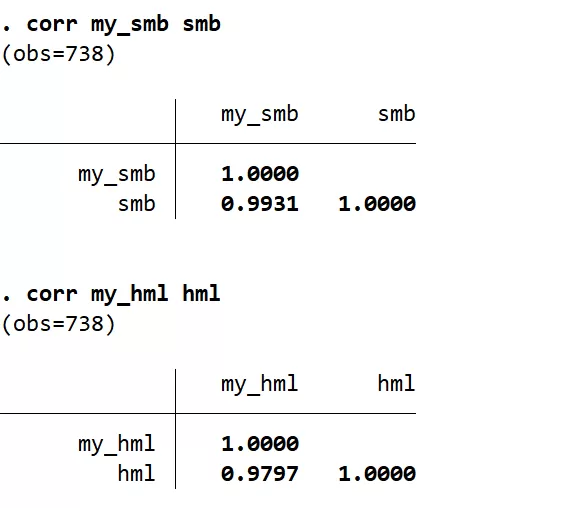
Fama and French have made the risk factors publicly available in their data bank “Kenneth R. French”. A comparison between our calculated factors and the factors from this data bank shows us that the SMB and HML factors have 99% and 97% correlation with the factors in the Kenneth R. French data bank. Furthermore, we proved that 98.62% of variations in our calculated SMB are explained by the SMB factor of Fama and French (from Kenneth website), and 95.99% of variations in our calculated HML are explained by the HML factor of Fama and French.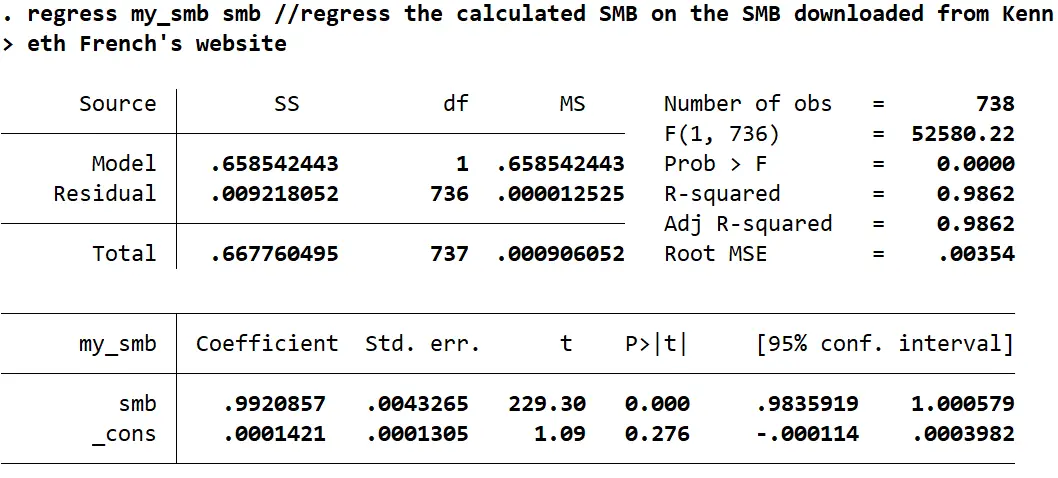
Reference
Fama, E. F., and French, K. R. 1993. Common risk factors in the returns on stocks and bonds. Journal of Financial Economics, 33(1), 3-56.
Shumway, T. 1997. The delisting bias in CRSP data. Journal of Finance, 52(1), 327–340.