
This article will go over how nested or hierarchical regressions are used in Stata. In many published academic papers, we see a single table representing results from various regression models run by the authors. Often, each subsequent regression adds one new variable to the list of covariates that an outcome variable is being regressed on. If you want to further explore this topic, you may refer to Chapter 10 of A Gentle Introduction to Stata by Alan C. Acock. A simple example of such a table is given below.
Download Example File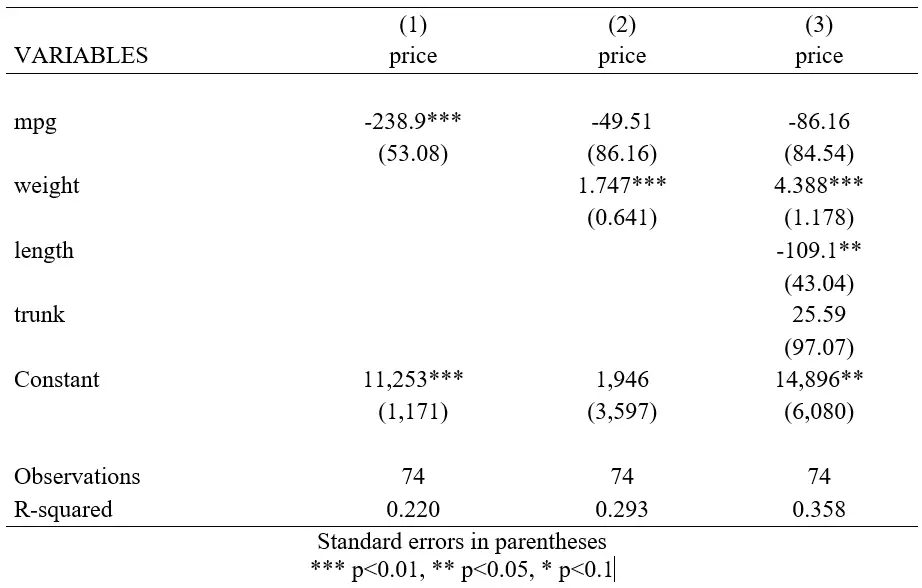
Each subsequent column adds a new variable that was added as a covariate in the regression. Model (1) saw ‘price’ being regressed on ‘mpg’. Model (2) added ‘weight’ as a covariate. Model (3) further added ‘length’ and ‘trunk’ as covariates. We say that models (1) and (2) are ‘nested’ within model (3).
How can we display nested/heirarchical regression tables in Stata?
For this example, will use Stata’s built-in auto dataset.
sysuse auto.dta
First let’s run a simple regression of ‘price’ on ‘mpg’.
reg price mpg
Now, if we want to run another regression with a new covariate, ‘weight’, we would typically run another separate regression.
reg price mpg weight
Say, we want to add more controls to our model through the ‘length’ and ‘trunk’ variables – we run another regression with these added.
reg price mpg weight length trunk
Instead of running and reporting all these regressions separately, we can make use of the nested regression prefix called nestreg before our regression command. It is called a prefix because it is added right before a Stata command. The syntax is simple. The prefix is added with a colon (no space between the prefix and colon) followed by the regress command and the dependent/outcome variable. The set of independent variables will be written in parenthesis. The parenthesis will indicate when a new model is to be run with an added covariate. The parenthesis can also have one or more variables.
nestreg: reg price (mpg) (weight) (length trunk)
In this example, there are three sets of parenthesis indicating that three models will be run. The first will regress ‘price’ on ‘mpg’ only. The second regression will then regress ‘price’ on ‘mpg’ and ‘weight’. The third model will add on ‘length’ and ‘trunk’ to the list of covariates as well (i.e. a regression of ‘price’ on ‘mpg’, ‘weight’, ‘length’ and ‘trunk’). Instead of heaving to run the three regressions separately, the nestreg prefix allows us to do so with one command where we can add new coindependent variables/covariates through parenthesis.
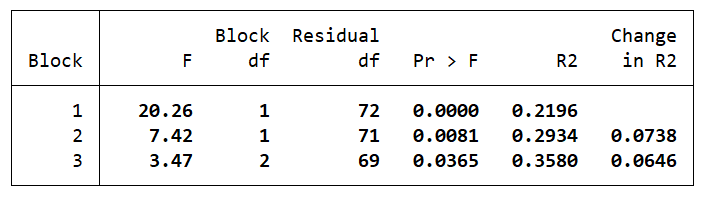
The nested regression method also outputs a table that displays the R-squared for all the regressions run along with the change in this statistics after a new (or a set of new) independent variables/covariates were added. This table helps in checking how the explanatory power of each of our regressions changed with the addition of the new variable(s). For example, the R-squared in the first regression (Block 1), as shown by the fifth column, was 0.2196 (or 21.96%). When we added ‘weight’ as a new control in the second regression (Block 2), this increased to 0.2934 or (29.34%). The last column also shows that this change was an increase of 0.0738 (or 7.38%). Similarly, the explanatory power of our third regression (Block 3) goes up by 0.0646 (or 6.46%) from the previous model to become 0.3580 (or 35.8%).
Related Article: Output Regression Analysis in Stata Using asdoc Command
Nested Regression Tables in Excel Format
Typically, to output regression tables to Word or Excel, the outreg2 command is used.
outreg2 using abc.xls, replace
However, you will note that when nested regressions are performed, the command will only output results from the most recent regression run while columns for the results from previous regressions in the hierarchy will not be added. In this case, it will only output results for the third model that contained four covariates, but not for the two regressions before that.
To get around this issue and report all regressions in a nested model in one table, we add an option called store() to the nestreg prefix. This will change our command like this:
nestreg, store(model): reg price (mpg) (weight) (length trunk)
The option is added following a comma but before the colon sign. The brackets will hold any name that you wish to give to the nested model that you want to output. Here, we simply named it ‘model’. This allows Stata to remember that the results from this particular nest will be referred to by the name ‘model’.
The store(model) option essentially names every single regression in the nest/heirarchy with the prefix ‘model’ followed by the number it assigns to that regression. The very first regression (reg price mpg) will be numbered 1, the one after that with an additional ‘weight’ control added will be numbered 2, and so on. Therefore, the first regression will be stored as ‘model1’, the second as ‘model2’, and the third as ‘model3’.
After this, we need to restore each of these models separately, and then use the outreg2 command to individually output them to one file.
nestreg, store(model): reg price (mpg) (weight) (length trunk) estimate restore model1 outreg2 using results.xls,replace estimate restore model2 outreg2 using results.xls, append estimate restore model3 outreg2 using results.xls
To reiterate, as shown above, you will first run the nested regression using the store() option. Each model in the regression will then be restored and output using the estimate restore and outreg2 commands respectively. So, in this example, after the nested regression, we first restore ‘model1’ and output it. This is then followed by restoring ‘model2’ and its output, and then ‘model3’ and its respective output.
Note that you do not need to specify the append option like we did when outputting ‘model2’. This is done by default in Stata i.e. it will append the results from the subsequent regressions to the same table as the previous regressions as long as they are being stored in the samefile (here, the filename is ‘results.xls’).
Related Article: Estimate Multiple Regression In Stata
Obtaining the Change in Significance of R-Squared
One shortcoming of the nestreg prefix is that it does not give us the statistical significance of the change in the R-squared values when a new covariate is added in a new regression model. In order to get this change in statistical significance in the R-squared each time a new variable is added in a regression, we use the following pcorr command.
pcorr price mpg weight length trunk
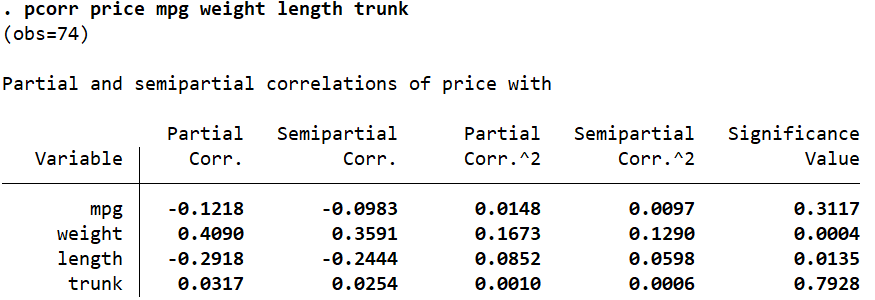
This table displays the partial and semipartial correlation coefficients (and their squares) of one variable (in this case, ‘price’) with each of the other four variables while the effects of the other three are omitted. So -0.1218 is the correlation coefficient or ‘price’ with ‘mpg’ while the effects of ‘weight’, ‘length’, and ‘trunk’ are removed. The table also shows the significance values of these partial correlations in the last column.
Regressions by Category
Let’s suppose that you want to perform the same regressions as above but separate them based on a certain category. In this example, we use the variable called ‘foreign’ which categorises the cars into two categories: domestic and foreign. We want to run the regressions above separately for the foreign and domestic cars. In order to that, we simply add the bysort prefix followed by the categorical variable.
bys foreign: nestreg : reg price (mpg) (weight) (length trunk)
This will perform six regressions: three nested regressions for cars that are foreign (i.e. when the variable ‘foreign’ == 1) and three nested regressions for domestic cars (‘foreign’ == 0).
Alternative to nestreg: hireg
There is another user-written command that does exactly the same job as the nestreg prefix called hireg (short for hierarchical regression). You may have to install it if you have not already.
ssc install hireg hireg price (mpg) (weight) (length trunk)
This command will return the same output that we got when we used the nestreg prefix.