Introduction to t-test:
The mean test or t-test is a test used to compare the mean of a variable in a group with a mean of the same variable in another group. For example, we want to compare the mean price of cars produced domestically and cars produced in a foreign country, so we will use the t-test for that comparison. Similar function of t-test in stata can also be performed. There is an in-depth discussion on t-test in Chapter 7 of A Gentle Introduction to Stata by Alan C. Acock. Let’s demonstrate it by importing the data using the following command:
Download Example Filesysuse auto.dta,clear
Once data is imported, summarizing the data will provide details of total number of observations, mean and standard deviation of variables present in the data. To summarize data, use the following command:
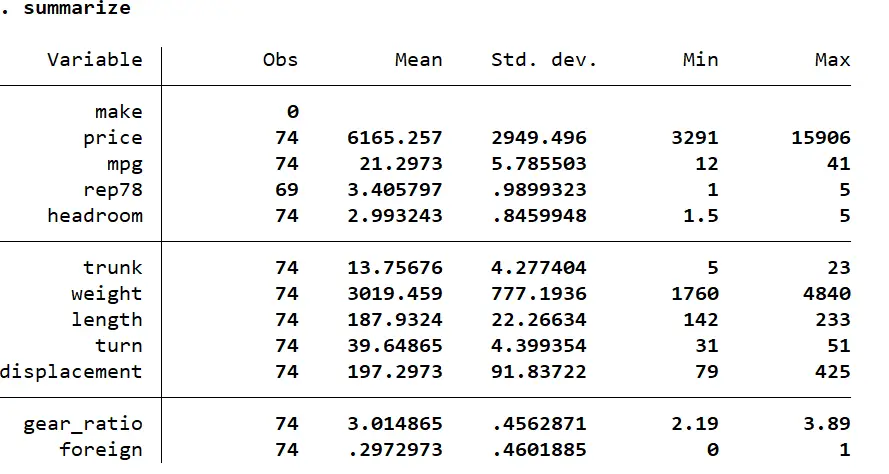
summarize
The following information will be laid out by using the summarize command. As seen from the picture below, the mean or average price of cars in our data is $6165.257.
But whether this mean is statistically significant or not? Statistically significant means a result generated by a certain experiment or data set is caused not by a chance, but by the actual relationship between variables. If a result is highly significant, it means it is more reliable, compared to the result that is least significant or not significant at all. Using different kind of t-test in stata can help us analyze the statistical significance of the results.
Related Article: Correlation Analysis in Stata (Pearson, Spearman, Listwise, Casewise, Pairwise)
Different Types of t-tests in Stata
To know the statistical significance of a result, t-test is used in statistics. We have three types of t-test to use in Stata. These are
- One Sample t-test
- Independent sample t-test/unpaired or two sample t-test
- Paired sample t-test
One Sample t-test in Stata
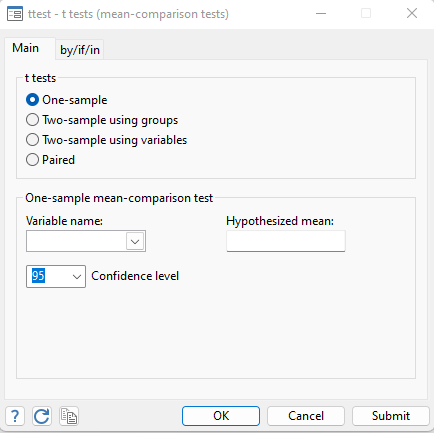
To know the usage of these t-test in Stata, we start with one sample t-test. We can find the t-test in stata from menu bar by using the following steps:
Statistics > Summaries, table and tests > Classical test of hypotheses > ttests-t tests (mean-comparison tests)
One sample t-test is used when we have a single group, and we need to compare the mean of that group to a known mean or a population mean. In this case we compare the sample mean with the hypothesized mean and that is mean prices of car, which is $6165.257. To carry out this process, we need to use one sample t-test in Stata, because we have a single group under study.
In statistics, two types of hypothesis are used for t-test. One is the null hypothesis and the other is the alternate hypothesis. Null hypothesis, in this case of mean prices of cars, essentially state that mean or average price of car equals around $6000. The alternate hypothesis, on the other hand, states that the average price of the car is not equal to $6000.
To execute one sample t-test in stata, the variable need to be used will be selected, which is the price in this case. Next, we will give a hypothesized value to this variable, which is $6000. Now, instead of clicking OK button, clicking on submit button will execute the command rightly.
The command that was executed for one sample t-test is
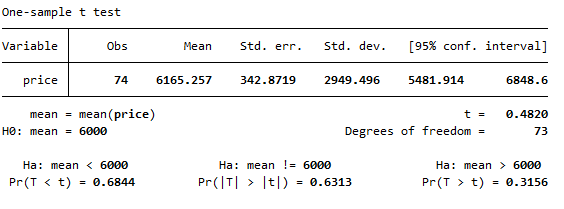
ttest price == 6000
Instead of manually clicking the one sample t-test, the above command is also used. The result we get from one sample t-test is:
Remember that result shows both null and alternate hypothesis. Exclamation mark (!) in the results show that result is not equal to the known value. Furthermore, we have two types of hypothesis. One is directional hypothesis and the other is non-directional hypothesis. In non- directional hypothesis we don’t provide the direction of results, instead we just say whether the result is equal to or not equal to a specific value. However, in directional hypothesis, we provide the direction of results that result is greater than or less than a certain value.
To interpret the results we got above, we need to introduce the p-value. P-value is the probability of getting a result and represent the level of statistical significance of a result. If p-value is less than 0.05, the result is statistically significant. The null hypothesis will be rejected because it says that average price of car equals 6000. As shown in the result, the p-value is 0.6313, so result is statistically insignificant and null hypothesis is rejected.
To demonstrate it further, let’s use another hypothesized value i.e. 3000. Putting the price equal to 3000, and using the command
ttest price == 3000
We get the following result
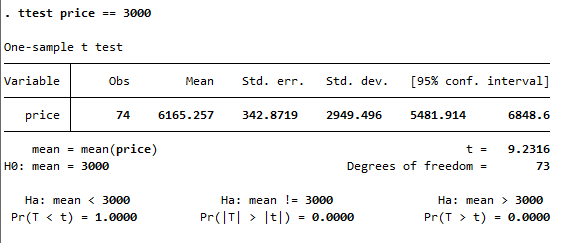
As evident from the above image, the p-value is below 0.05 and results are statistically significant. Results are suggesting that average price of car is not equal to 3000, rather it is greater than 3000.
Independent Sample t-test/Unpaired/two sample t-test in Stata
Two sample t test is used when we have two different groups, and we need to compare the difference in means of these two groups.
Now in our data set, we already have a variable named price, which is the price of the car. But in two sample t test we need another to categorize variable into two, so we take the already present variable in the data set named “foreign”. The foreign variable is binary, i.e. it can take two values 0 or 1. So the car could be either produced domestically or in a foreign country. If it is produced domestically, the value of foreign variable will be 0 and if it is produced foreign it will take the value 1.
Foreign variable: Binary (0, 1)
Car produced in domestic country = 0
Car produced in foreign country = 1
To compare the means of a variable named price and a variable that is further categorized into two samples, called foreign, we need to use the independent sample t-test or two sample t-test. In Stata, independent sample t-test is further divided into two types, one is two sample using groups and the other is two sample using variables. The difference between these depends on the data set being used. If the data set is in long format, then we would use “two sample t-test using group”, and if data set is in Wide format the “sample t-test using variable” will be used.
Two sample using Groups
In our case, the data set being used is in long format. The difference between long data and wide data is that in long data all values are present in one single column and values often get repeated too. However, in wide data format, values are further categorized into sub groups. For example in our case, price variable is long variable because it contains prices of cars produced both domestically and in foreign country. However the variable foreign categorizes the prices into domestically produced cars and those produced foreign.
Following the same path as used earlier for one sample t-test,
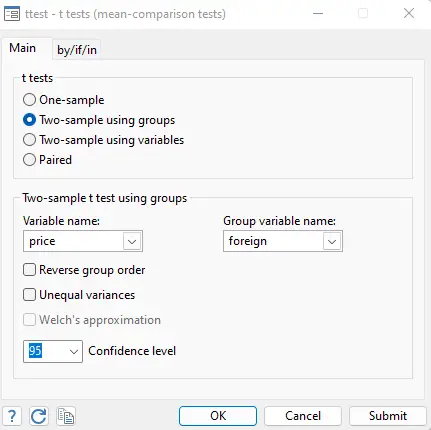
Statistics > Summaries, table and tests > Classical test of hypotheses > t-test-t tests (mean-comparison tests) > Two sample using groups
The following window will appear, where the variables Price and foreign will be used in the given boxes.
Related Article: Reporting Summary Statistics in Stata Using Outreg2
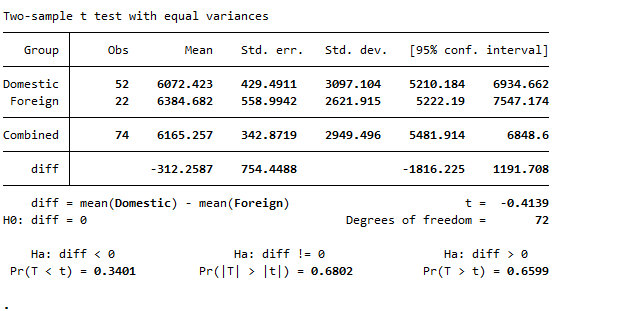
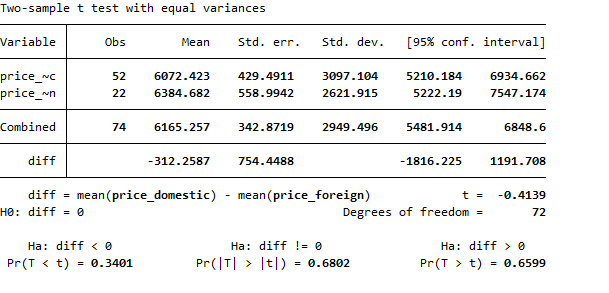
Clicking on the submit button, we get the following result,
Before interpreting the results, we first need to conceptualize the null and alternate hypothesis in this case. Null hypothesis state that mean price of domestic cars and mean price of foreign cars is equal, so the difference between price of foreign and domestic cars become zero. However, alternate hypothesis state that mean price of domestic car and mean price of foreign car is different.
To accept or reject the null hypothesis, we have to look at the p-value in our results. P-value, as explained earlier, describes the statistical significance of a value. The p-value in the results shown above is 0.6802, that is greater than 0.05. The p-value greater than 0.05 implies the statistical insignificance of a result, so our results are insignificant and we reject the null hypothesis stating that mean prices of foreign and domestic cars are same.
Two Sample using Variables
Previously, we used two sample using groups to find out the relationship between a variable (price) and a variable with two samples (foreign). Now we need to find out the relationship between two variables using the command in stata. For that, we will import another data set in the Stata. Let’s import price data. This price data is similar to the one we used in above example except that we have changed the formatting of the data i.e. in previous example data was in long format and now the data is in wide format. So let’s import the data using following command.
use “price data.dta”, clear
As shown in the data, there are now two variables for prices for domestic and foreign cars instead of merging them in a single variable and making it a binary variable. Domestic cars have a variable named price_domestic, and foreign cars have a variable named price_foreign.
Now to get the t-test of these two variables, we will follow the following path:
Statistics > Summaries, table and tests > Classical test of hypotheses > t-test-t tests (mean-comparison tests) Two sample using variables
Now the third option in the window appeared will be chosen because we need to test sample using variables.
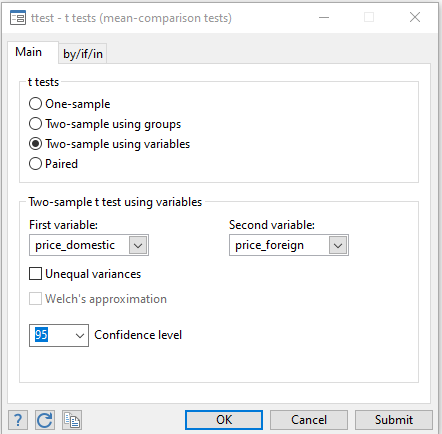
In the variables box, the first variable chosen will be price_domestic and second variable will be price_foreign. You can use whatever you wish to use as a first or second variables from price_domestic and price_foreign, it wouldn’t have any impact on the results.
We can also run the t-test two sample using the variables manually by inserting the following command:
ttest price domestic == price foreign, unpaired
So clicking on the submit button, we get the following results
As you can see that values we got here are exactly the same as values in the previous results. The p-value and mean prices of domestic and foreign cars are essentially same and no difference in results could be seen. So getting t-test two sample using groups or variables provide us the same results and their interpretation also remains same.
Paired Sample t-test in Stata
The last option in Stata for the t-test is paired sample t-test. Paired sample test is used when we have same entities or same subjects but their data is in different time periods. For example, if we have data of an object before and after an experiment, and we want to compare the mean of subject before and after an experiment, paired sample t-test is used.
For paired sample t-test, we will use a different data set. To import the data, run the following command
sysuse bpwide.dta,clear
In the data imported, we have two different type of variables. These variables are patient’s blood pressure before and after a certain experiment that is done on him. The experiment could involve giving a medicine to the patient and blood pressure recorded before the medicine and after the medicine is used for analysis. To compare the mean of blood pressure before the medicine and after the medicine, paired sample t-test is used.
Statistics > Summaries, table and tests > Classical test of hypotheses > t-test-t tests (mean-comparison tests) > Paired
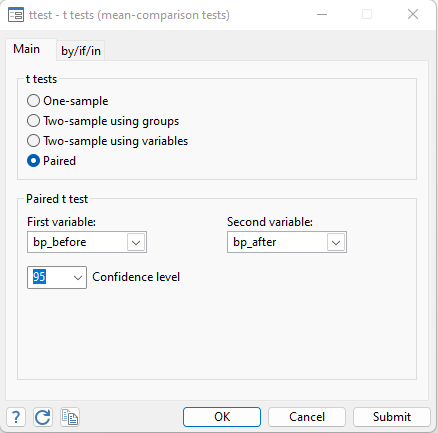
The following window will appear where the first variable is blood pressure before the medicine (bp_before) and second variable is blood pressure after (bf_after). Click on the submit button to get results.
We can also use the following command to get result of paired sample t-test.
ttest bp_before == bp_after
Result we got from paired sample t-test are:
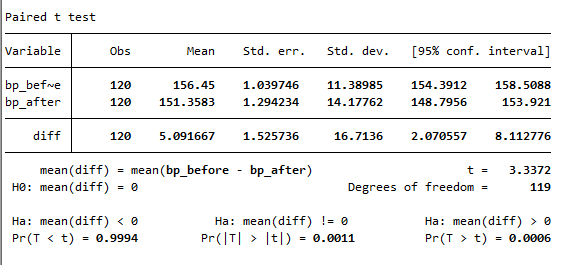
Before interpreting the results, we define our null hypothesis which says that difference between mean blood pressure before and after the medicine is zero. Interpreting the results, we can see that blood pressure before the medicine is 156.45 and after the medicine is 151.3583. So mean before and after the medicine is different. However, the p-value we got is less than 0.05, so the results are statistically significant. Thus we reject the null hypothesis based on the fact that difference between mean value before and after the medication is not equal to zero.
Related Article: How to Perform the ANOVA Test in Stata
Standard Deviation:
Other than getting the mean of samples, we can also get standard deviation of samples from the t-test. To get that, let’s import the auto data again by running the following command:
sysuse auto.dta,clear
To test, whether the standard deviation of a variable i.e. price is equal to 2000, we will use the Standard deviation. We can use the command and/or get the Standard deviation test by clicking on the menu window.
To manually run the Standard deviation test, following path is used.
Statistics > Summaries, table and tests > Classical test of hypotheses > variance comparison test
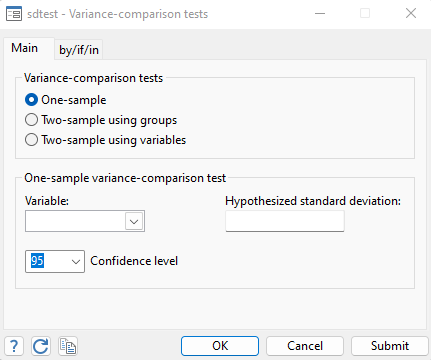
In the above window, we got bunch of options like getting standard deviation test using one sample, two-sample using groups, two-sample using variables, but we will stick to the first option of one sample.
Selecting the variable as price and setting the hypothesized value of 2000, we click on submit button and get the following results.
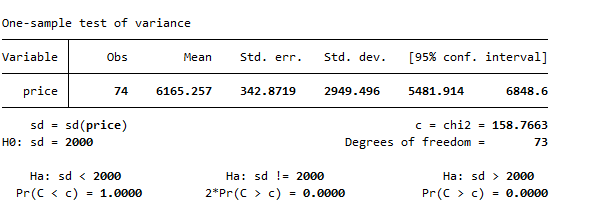
We can also get the above results using the following command:
sdtest price == 2000
Where the 2000 is hypothesized value.
Test Proportion:
To get the proportion test, we again follow the menu window:
Statistics > Summaries, table and tests > Classical test of hypotheses > Proportion test
The following window will appear with many other options, but we will stick with one-sample option
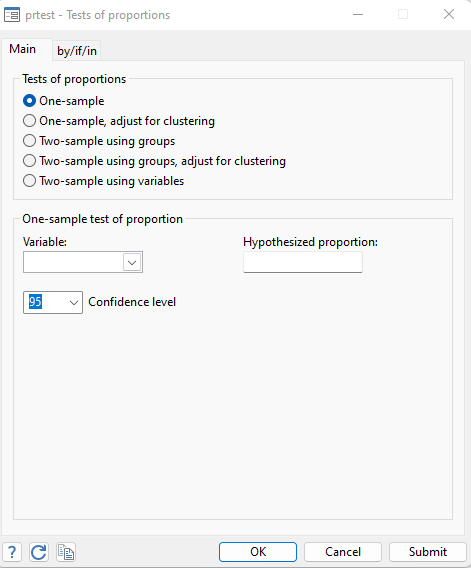
In variable option if we chose the price, we cannot use the hypothesized value as 2000 or something like that. This is because proportion value is either 0 or 1. As price cannot be 0 or 1 so we have to use any other variable which is binary or have values of 0 or 1. Remember that in initial data, we have a variable named foreign whose values lie between 0 and 1. So we can use that variable for proportion test.
Let’s put the variable foreign and hypothesized value as 0.5 in the proportion test.
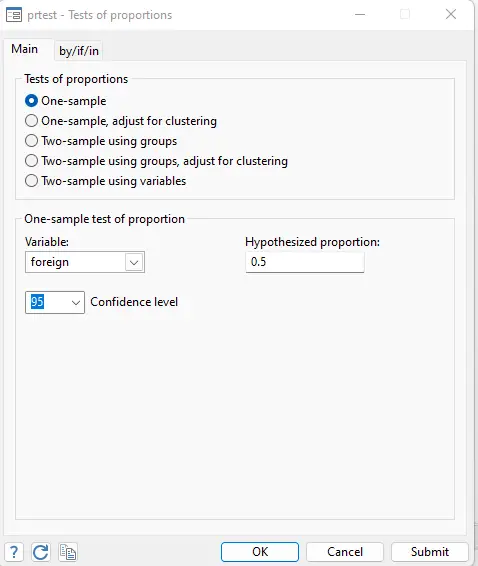
Clicking on the submit button, we get the following results
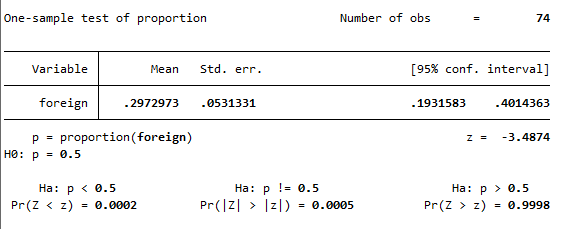
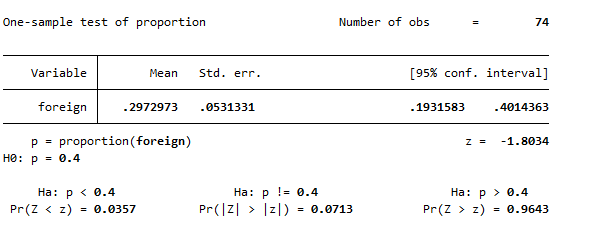
Our null hypothesis state that proportion value is 0.5. But in the result, null hypothesis can be rejected because proportion value is not equal to 0.5.
Looking at the data, we can see that we have around 40% of foreign cars, so putting the proportion value as 0.4, we again run the command
prtest foreign == 0.4
We get the following results