
This article is focused on standardized variable, normalization of variable and mean centering of variable in Stata. A standardized variable is a variable rescaled to have a mean of zero or close to zero and standard deviation one. Standardizing variables become necessary when the data requires you to assign equal weight to each variable. Once the variables have been standardized, you can see how much one variable is away from mean and standard deviation. For example, if a variable has mean 2 and standard deviation 3, this means that it is away from 2 points in mean and 3 points in standard deviation.
While one can standardize variables manually, it can also be done using software like Stata. The process of standardization essentially requires you to subtract the variable from mean and divide by standard deviation. To get started in Stata, let’s start by importing the Automobile data in Stata. Use the following command to import data
sysuse auto.dta
The data imported contains different information related to cars, including their prices, whether they were manufactured domestically or in a foreign country, their mileage and so on.
Generate Standardized variables By using Commands:
As discussed earlier, the variables can be standardized manually by subtracting mean and dividing by Standard deviation. To follow this step in Stata, summarize the data to get mean and standard deviation of variables in Stata. Use the following command to summarize data
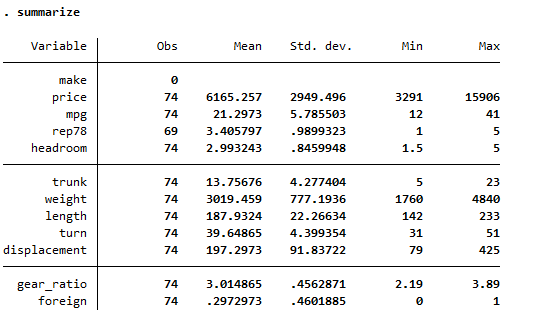
summarize
The following summary table will be generated, showing total observations, mean and standard deviation of data
Now, we want to standardize a variable, let’s say price. To standardize this variable, we have to subtract the mean of price variable and divide by standard deviation. It is important to note that we create a new variable for price that would represent the standardized variable of price. The command for this step will be following
gen pricenew = (price - 6165.257)/2949.496
The new variable of standardized price will be generated by the name of pricenew. Now we get the summary statistic of the newly generated variable, to see whether it has been standardized or not. To get the summary statistics of pricenew variable, use the following command
sum pricenew
Following summary statistics will be generated
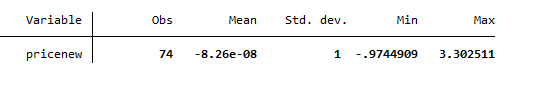
The above image shows that mean of variable is quote small, nearly zero and standard deviation of the variable is 1. Thus, the variable has been standardized.
This might seem like a lot of work to standardize a variable, using mean and standard deviation values of the variable, especially if you are dealing with a large data. There is an easy way to standardize the variable, simply by using std function as used in the following command
egen pricenew1 = std( price)
In the above command, we just have to use the std function and write the name of variable in parentheses to standardize the variable. Note that it is important to generate a new variable using egen function, while standardizing the variable by std function in Stata.
Now, to check whether above generated variable has been standardized or not, we take its summary statistics and compare it to the original variable’s summary statistics. To take summary statistic of both newly generated variables and the original variable is by using following command
sum price pricenew pricenew1
The summary statistics are shown below for all three variables
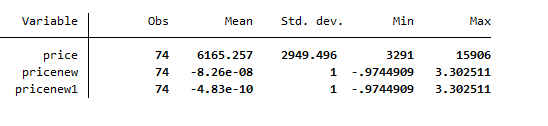
The table above shows that price variable is non-standardized, having a certain mean and standard deviation. However, the newly generated variables are standardized because their means are closer to zero and standard deviation is exactly 1. So the variables have been standardized by following the methods used above.
Generate Standardized Variables using Window Menu
One way to standardize variable is by creating a new standardized variable through window menu. To do so, use the following path mentioned
Data > Create or Change Data > Create a Variable (Extended)
The following window appeared needs to be filled by the name of new standardized variable, the variable need to be standardized and in egen function select the standardized values, as shown below
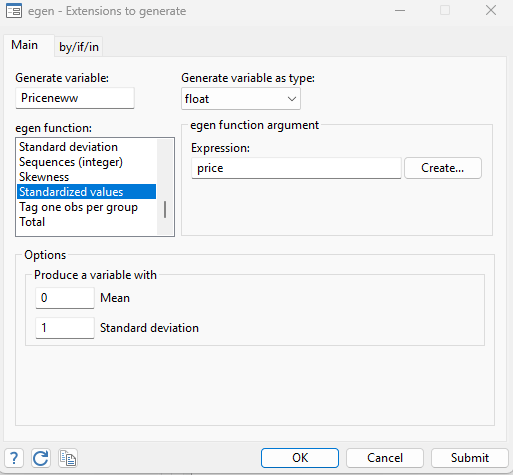
Once we click on the submit button, the standardized variable by the name of priceneww will be generated.
Normalizing Variables in Stata
Normalizing variables is also a statistical process that is used to transform the values of a variable to a standard or universal scale or range. When different variables are present in data with different scales or units, i.e. prices of cars in US dollars, and Euros, variable need to be normalized. This transformation ensures that variables with different scales or units are comparable and can be analyzed together.
In Stata, you can normalize variables using various techniques. One approach is to standardize the variables, that we discussed earlier in this article. The second approach is to start the scale at 0 and ends it in 1. It is essentially similar to standardizing the variable, which has zero mean and 1 standard deviation. However, the method to use this technique can be different. To normalize the variable, the basic formula used is as following
New variable = (Original variable – min value )/(max value – min value )
In the above formula, new variable is the normalized variable that needs to be generated. Original variable, as the name says is original variable and min and max values are the minimum and maximum values of the original variable, derived from the summary statistics.
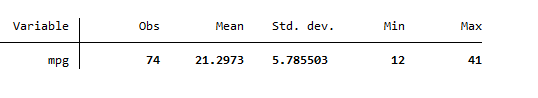
So if we want to normalize a variable in Auto data, say mpg variable, we first use the following command to get its summary statistics and find out its minimum and maximum value
sum mpg
The following summary statistic will be generated, showing the minimum and maximum values for the variable
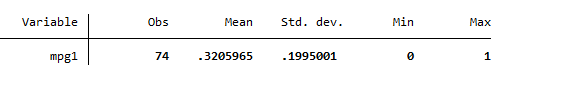
The next step is to normalize variable, that we can do by generating a new variable. The following command will be used to normalize a variable
gen mpg1 = (mpg - 12)/(41-12)
The new variable by the name of mpg1 has been created. To get its summary statistic, again use the following command
sum mpg1
As the new summary statistics shown below verifies that newly generated variable has been rescaled from 0 to 1.
Mean Centering of Variables in Stata
Mean centering is also a statistical technique used to adjust variables by subtracting the mean value of the variable from each observation of the variable. The purpose of mean centering is to remove the mean as a source of variation in the data. It allows you to focus on the deviations from the mean. The ultimate outcome of mean centering is that mean of new variable, created by subtracting the mean value of original variable from its each observation, to have a zero mean.
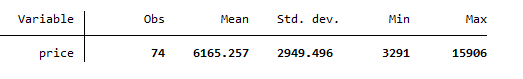
To mean center a variable e.g. Price, we take its summary statistics using the following command
sum price
The following summary statistics will be generated showing mean, standard deviation, minimum and maximum values of price variable.
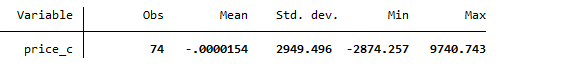
To have its mean center, use the following command. The command given below subtracts the mean value of price variable from its each observation and create the new variable of price by the new name.
gen price_c = price - r(mean)
We have used a scalar r(mean) that stored the mean value from the summarize command. The new variable generated has the summary statistics provided by image below. This summary statistic was created using the following command
sum price_c
Mean centering is often used in regression analysis, where it can help to interpret the regression coefficients more easily and avoid multicollinearity issues, specifically, when including interaction terms. Additionally, mean centering can be beneficial when comparing variables on different scales or when examining within-subject or within-group effects.