
This article goes over what scalars and matrices are and how to work with them in Stata. To illustrate the concepts, we will use Stata’s built in automobile dataset which can be loaded by using the following command:
Download Example Filesysuse auto.dta, clear
What Are Scalars and Matrices
Scalars can be defined as placeholders in Stata that can store a single number or a single piece of string. Matrices, on the other hand, can store multiple numbers or strings.
Defining Scalars in Stata
In order to define a scalar in Stata, we use the following syntax:
scalar a = 123
Where a is the name of the scalar. You can replace it with whatever name you find appropriate.
In order to display the content that is stored in a scalar that has been defined, we simply use the display command:
display a
Related Article: Local and Global Macros in Stata
This will display ‘123’ in the result window in our example.
We can also generate a new variable and assign it a value that is already stored in a scalar.
gen var1 = a
‘var1’ will not have the value of ‘a’, rather it would take on the value represented by this scalar, which is ‘123’.
Scalars can also store the result of an operation as well. For example, we can also define a scalar as follows:
scalar b = 2+2 display b
The display command will return a result of ‘4’.
We can also store strings in scalars by enclosing our string in inverted commas:
scalar c = “2 plus 2 is equal to”
In order to display two scalars together, we can simply display them together:
display c b
This would result in the output ‘’2 plus 2 is equal to 4’’.
The display command can also return us the result of operations performed on scalars. For example,
display b+a
would return us an output of ‘127’.
Related Book: Data Management Using Stata by Michael N. Mitchell
Defining Matrices in Stata
As mentioned above, matrices store multiple values in rows and columns. To define matrices, we use a syntax slightly different to scalars:
matrix define d = (4,5,6\7,8,9)
In this example, ‘d’ is the name of the matrix which can be set to whatever name you find appropriate. The first set of three values, separated by commas, ‘4, 5, 6’, make up the first row of the matrix. The backward slash indicates that a new row is to be started.’7,8,9’ will therefore make the second row of the matrix. Displaying the matrix through the following command helps us understand how it looks like:
matrix list d
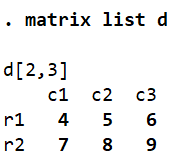
If there were no backslash, the matrix would only have one row with the six numbers each in a column. It would then be just a row vector with one row and six columns. Similarly, if we had separated all our numbers with backslashes (and no commas), it would become a column vector with the numbers arranged in one column and six rows.
If we would like to display a specific value from this matrix, we can specify the row and column that needs to be displayed as follows:
display d[1,3]
This command tells Stata to display the value in the first row and third column of matrix ‘d’.
Related Article: Extract Results From Analysis | E-Class and R-Class Commands
Scalars and Matrices
We can use a scalar to store a value defined in a matrix. For example:
scalar e = d[1,2]
This scalar, called ‘e’, stores the value present in the first row and second column of matrix ‘d’. ‘e’ would thus store the value of ‘5’ as can be seen from the command:
display e