
In this article, we will shed light on the portfolio’s construction and how its returns (both value weighted and equally weighted returns) can be calculated. The data required to construct the portfolio and return is shown in the figure below. The data set is a panel that includes multiple firms’ data for years.
Download Example File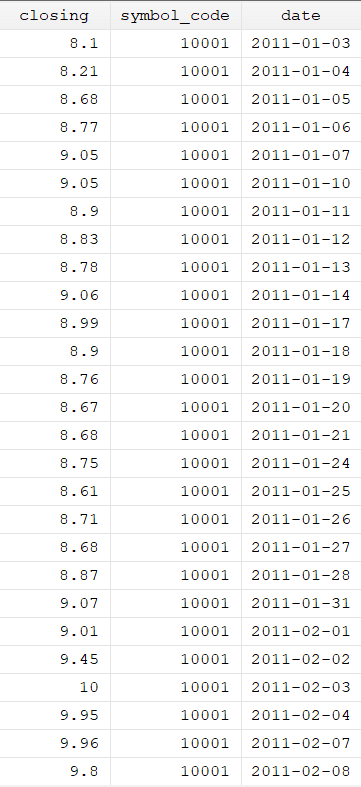
The command used to construct the portfolio is xtile. xtile command can be used as both a function and a command. First, we will see how it can be used as a function, and second, we will see how we can use it as a command
Xtile as a Function
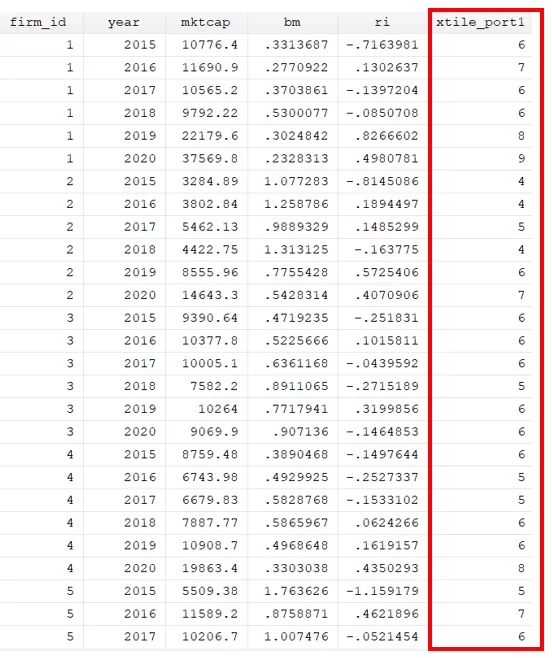
egen xtile_port1 = xtile(mktcap), nq(10)
Initially, the portfolio generation process will be initiated with the egen command. The function of this command is to generate a variable. Next, we will specify the name we want to assign to the variable holding our portfolio data (xtile_port1). After the equals sign, we will employ the xtile function. The variable name on the base we want to generate portfolio generation will be specified within the brackets. In our case, it is mktcap (market capitalization). Lastly, the number of portfolios to be generated will be denoted within the brackets labeled as nq.
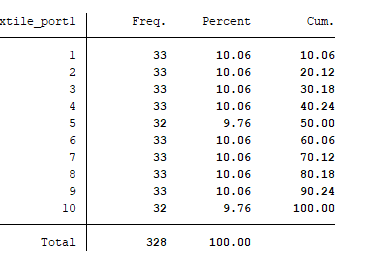
We can use the below command to see how many observations each portfolio comprises.
tab xtile_port1
Xtile as a Command
Another approach to generating a portfolio involves utilising the xtile as a command. The syntax where xtile can be used as the command is given below:
xtile temp=mktcap,nq(10)
Firstly, we will write the command and then the name of the new variable generated. After the equals sign, we specify the variable based on which the portfolio should be generated, such as mktcap (market capitalization). Finally, the number of portfolios to be produced will be specified in nq brackets. Furthermore, this command will generate a portfolio titled “temp.” Notably, the portfolio outcome remains consistent irrespective of whether xtile is used as a command or a function.

The egen command is widely regarded as the most effective approach for generating portfolios for various reasons. The issue with using xtile as a command is that we cannot create portfolios based on some categories i.e. years. If you wish to create portfolios based on different categories such as different years, then we need to use bysort prefix with the command. However, we cannot use bysort with xtile as a command. Therefore, it is more suitable to use egen command with xtile function.
Portfolio for Each Year
Before proceeding further, it is a must to install the package of egenmore using the below command.
ssc instal egenmore
Since the default egen command does not provide compatibility of using bysort with some functions such as xtile. Therefore, it is essential to install the egenmore package. By installing the egenmore package, we can now use bysort event for the functions where the capability is not available by default.
Let’s, create 10 portfolios based on market capitalization for each year. Using the below command, we will be able to generate the portfolio for each year:
bys year: egen xtile_port2 = xtile(mktcap), nq(10)
This bys (by sort) to generate the portfolio can only be used with the first method. This will construct the portfolio for each year by sorting the data on the basis of mktcap (market capitalization). The two variables will be generated, as shown in the figure below.

It is essential to consider certain limitations of the xtile command. A potential limitation of this approach is its tendency to exhibit slowness when handling large datasets. As the size of the dataset increases, it is likely that the processing time for constructing portfolios using xtile will increase.
Astile
To tackle this matter, an alternative user written command known as astile can be employed to create portfolios. The utilisation of the astile command presents a viable resolution in scenarios where the dataset is of considerable size, as it endeavours to enhance efficiency and speed up portfolio formation. The below can be used to install the astile package.
ssc install astile
Let’s generate portfolios using astile command.
bys year: astile astile_port1 = mktcap, nq(10)

It is worth noting that portfolios generated through the xtile and astile are same.
Equal Weighted Returns
The next step is to evaluate equal-weighted returns for the portfolio constructed. The equal weight return is a proportional measurement technique that gives equal significance to every stock in the portfolio. In the evaluation of the overall performance of a group, the stocks of the smallest companies are assigned the same weight as those of the largest companies. Before that, we will drop all extra portfolios created and keep only one portfolio that is astile_port1 using the below command:
drop xtile_port1 xtile_port2 temp
Now to calculate the equal-weighted return, the below command will be used:
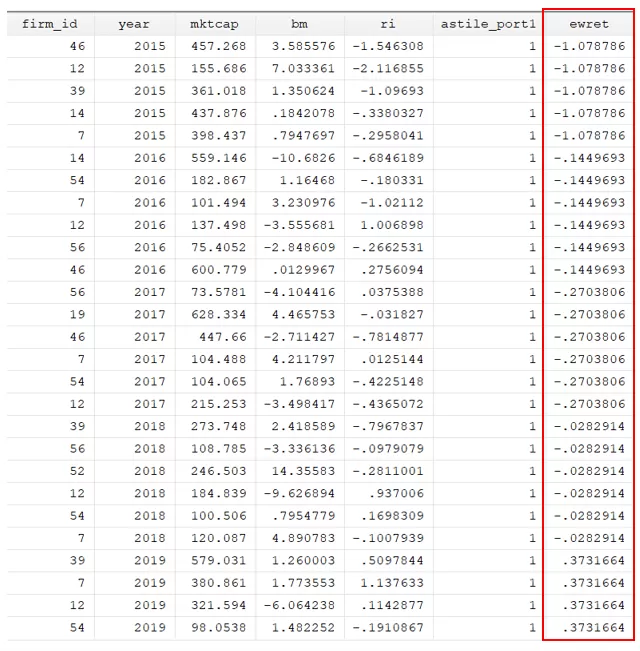
bys astile_port1 year: egen ewret = mean(ri)
Subsequently, a new variable will be created to represent the average return of every portfolio. The average return will be calculated for each portfolio, considering their returns.
Value Weighted Portfolio Return:
A weighting methodology, known as market value weighting is utilised to compute portfolio return. This approach assigns weight to each asset in the portfolio based on its market capitalization. The value-weighted portfolio return can also be calculated using mktcap (market capitalization). The first step is to estimate the market capitalization of each portfolio for each year. The command is given below:
bys astile_port1 year: egen totalmktcap = total(mktcap)
This command will generate the new variable, totalmktcap, which is the sum of each portfolio’s market capital for every year. All firms in one portfolio will have the same market capitalization.

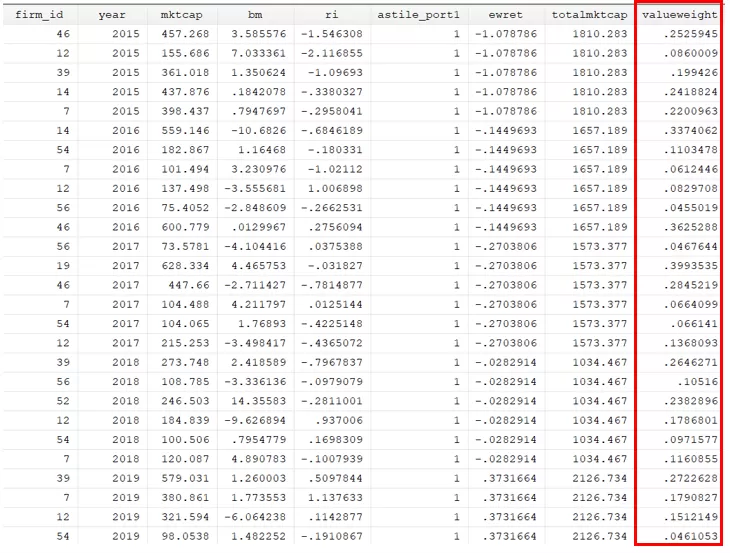
After this, we will generate a new variable with the name as value weight. This is the fraction of mktcap and totalmktcap. This variable represents the weight of each firm stock within the portfolio.
gen valueweight = mktcap/totalmktcap
The next step involves an evaluation of the weighted returns, which can be computed by multiplying the returns of individual portfolios by the associated weights.
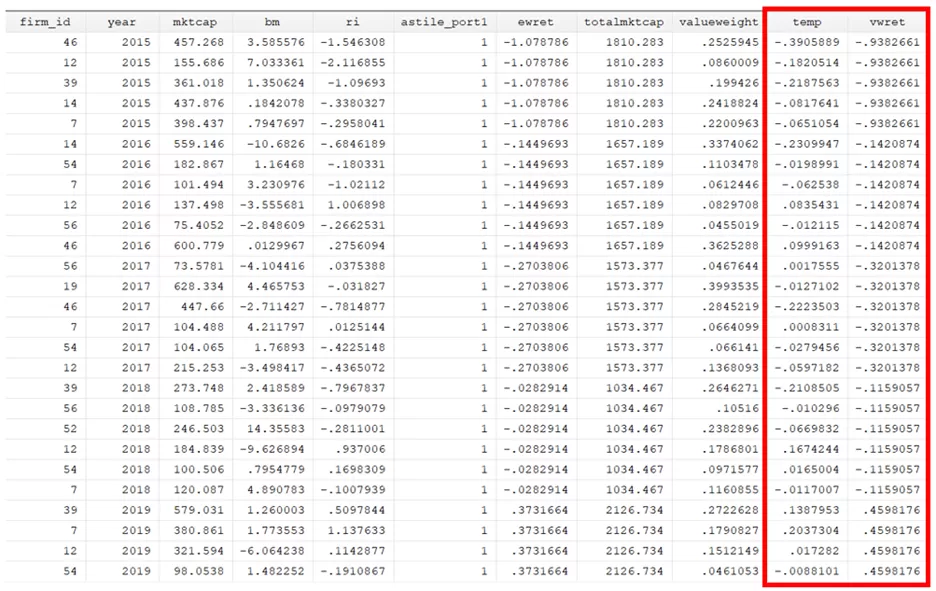
bys astile_port1 year: gen temp = ri*valueweight
After calculating the weighted returns for each portfolio, the next step is to aggregate these returns. The process of aggregation can be executed by using the below command.
bys astile_port1 year: egen vwret=total(temp)
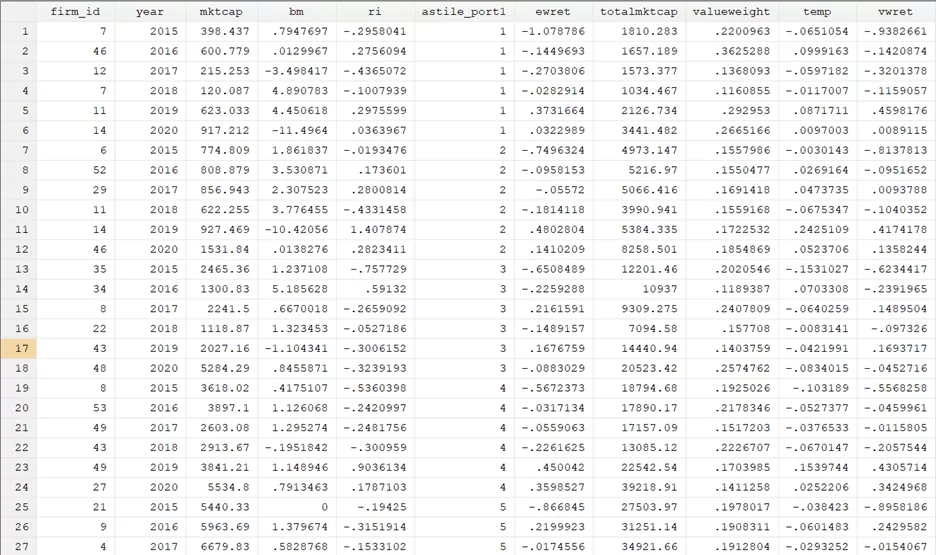
The following command will be employed to simplify the data to the portfolio level. Each portoio for each year has the same return in the vwret column so we want to convert data to portfolio level by keeping only one observation for each portfolio each year.
bys astile_port1 year: keep if _n == _N
It will allow us to consolidate the data and organize it in a specific way for each portfolio.
Percentile Ranking Portfolio
Portfolios are constructed in different research studies using percentile rankings. For instance, stocks ranked below the 80th percentile are classified as small, whereas stocks that surpass the 80th percentile are categorised as large.
bys year: egen p80=pctile(mktcap),p(80)
This command will help get the 80% percentile value, on the basis of which we will decide if the stock is small or big. To classify a stock as either “small” or “big” based on the 80th percentile value, we can use the following pair of commands to produce a variable that would contain portfolio categoriziation:
bys year: gen size="small" if mktcap<=p80
The command will allocate the attribute “small” to stocks with a value lower than the 80th percentile.
replace size="big" if size==""
The above command will allocate the attribute “big” to the stocks whose values are above the 80th percentile.

One-Dimensional vs Two-Dimensional Sorting
Before proceeding further, it is a must to understand the difference between one-dimensional and two-dimensional sorting. The categorization of portfolios in portfolio analysis and sorting can be classified as either one-dimensional or two-dimensional, depending on the number of variables or factors utilised for division and categorization. We can also use the work of one-dimensional and two-dimensional portfolios. You will notice that all the portfolios generated in previous sections are divided based on market capitalization. As they are divided on the basis of one variable, they are known as the one-dimensional portfolio. In this case, one-dimensional sorting has been done.
The method of two-dimensional sorting refers to dividing a given sample or set of portfolios based on two different variables or factors. In our example, in a two-dimensional portfolio, the initial division of portfolios would be done on the basis of market capitalization, like one-dimensional sorting. However, each market capitalization portfolio will be further subdivided based on an additional variable, namely, book to market value. The portfolio construct will be known as the two-dimensional portfolio. Fama and French and many other studies have worked on two-dimensional portfolios.
First, we will use the same command as above to generate a portfolio based on the market capitalization.
bys year: astile astile_port1 = mktcap, nq(2)
Now the above-constructed portfolio will be further categorised using book to market ratio as given in below command.
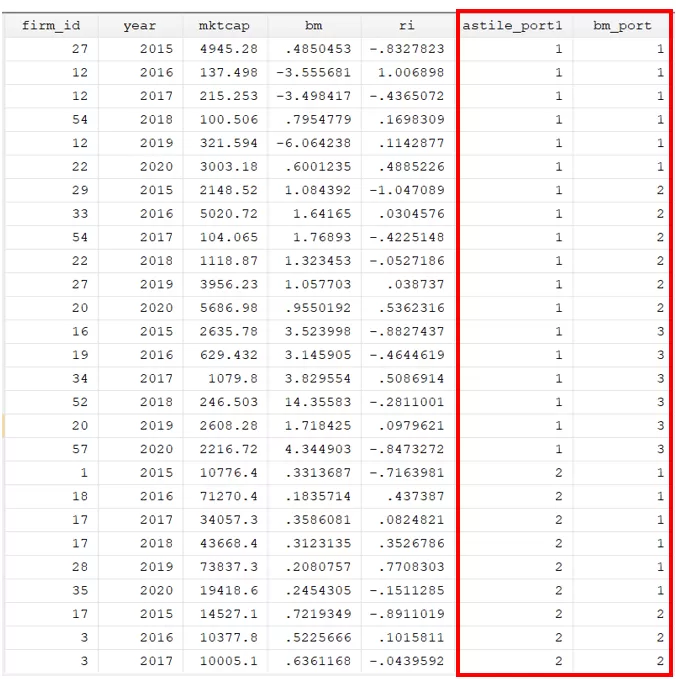
bys astile_port1 year: astile bm_port=bm,nq(3)
For each portfolio size (astile_port1) and year, we will be able to generate a new portfolio (bm_port) based on the basis of book to market ratio (bm). The portfolio will be categorised into three categories. Hence on the intersecation of size and book to market ratio we generated 6 portfolios i.e. Small high book to market (SH), small medium book to market (SM), small low book to market (SL), big high book to market (BH), big medium book to market (BM) and big low book to market (BL). Although Fama and French did not used the exact same cutoff point but this is basic tutorial on portfolio analysis. If you are interested in code related to different sorting or portfolios such as momentum etc., please feel free to contact us at [email protected].
Next, equal-weighted returns can be generated for two-dimensional portfolios, too, by using the below command:
bys astile_port1 bm_port year: egen ewret = mean(ri)
The above command has generated the equal-weighted return (ewret) for each size, book value, and year portfolio.

bys astile_port1 bm_port year: keep if _n == _N
As discussed, the above will allow us to consolidate the data and organise it in a way specific to each portfolio.
