
Descriptive statistics in stata is used when we need to learn about details of observations of variables in data, their frequencies, mean, median and variability to analyze data. The summary statistics or descriptive statistics of categorical variables can be generated in Stata quickly, making it easy to analyze data. Generally, while working with categorical variables, we are usually interested in percentage distribution, frequencies and bar charts/graphs of the data.
Categorical data is a form of collected information that is divided into groups, but it doesn’t follow any order. For instance, in our case, the data is categorical and has variables named age, gender, and survey or questionnaire questions. This article is motivated by Chapter 5 of A Gentle Introduction to Stata by Alan C. Acock.
To get the summary statistics of the variables or descriptive statistics in stata, we will use the windows command. Note that, for the categorical variables in our data, our focus will be on getting frequency of the variables. To do that, download the data from the files below
Download Example FileNow to get summary statistics of the variables, follow the path below
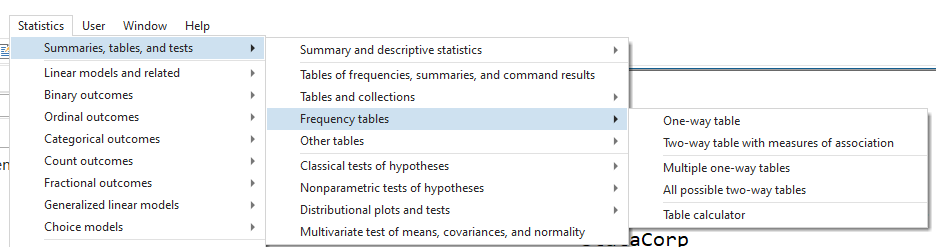
Statistics> Summaries tables and tests> Frequency tables
The following five options will appear in the window, but we will be dealing with first four of options.
One way Tabulation using tab Command
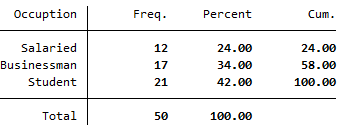
Starting with first option, that is one way tab or one way tabulation, we can get frequency of one variable using this option. So if we need the frequency of a variable, say, occupation, we use the following command
tabulation occupation
or simply
tab occupation
The following result will be generated, providing the detail of the frequency of the variable
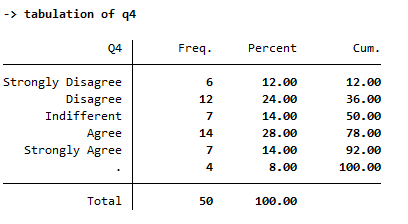
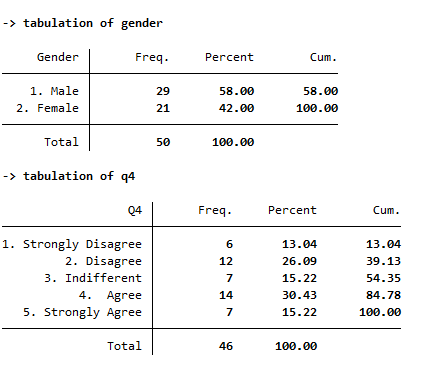
Similarly, if we need the frequency of gender or the details of question 1 of our Questionnaire, we will use the following commands
tabulate gender tabulate q1
The commands will generate following details about the frequency distribution of gender and Question 1. Remember that, as categorical variables are divided into groups, we have groups of all variables and for question 1. For instance, the groups are based on a Likert scale , whose answers range from 1 to 5, describing strongly agree or strongly disagree.
Related Article: How to Perform the ANOVA Test in Stata

Multiple One way Tabulation for descriptive statistics in Stata
To get the summary statistics of data, we wrote three commands individually. However, we can save our time, especially when it comes to larger data set. This can be done by using one command to get summary statistics of all the variables required. For instance, instead of writing individual commands of tabulation for variables, I can use the following command, and get separate results for each variable.
tab1 occupation gender q1 q4
Here, I needed the descriptive statistics of variables occupation, gender, question 1 and 4. So instead of using separate tabulate commands, I wrote them together and got separate results in form of the tables.
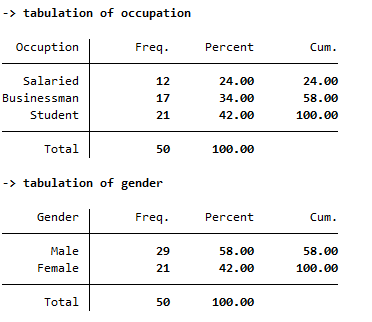
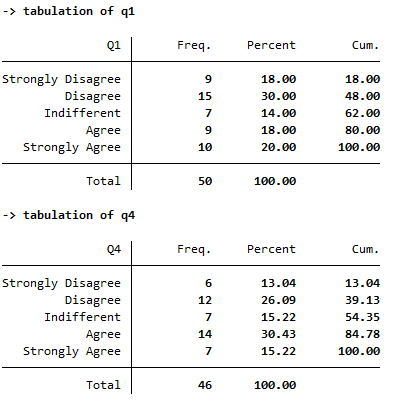
As evident from the above images, separate tables are generated for the variables.
Instead of writing commands, we can also do multiple one way tabulation by using the following path
Statistics> Summaries tables and tests> Frequency tables> Multiple one way tabulation
In multiple one way tabulation, choose the variables that you want details of, and click the submit button.
Now, from the above images, note that we can see that all variables have 50 observations, but the last variable named “q4” has 46 observations. This means that 4 observations are missing in this variable. Dealing with large data, we might have not noticed the missing values and run the data analysis, which can lead us to wrong analysis and results.
So if we wish to take missing values in account and run the analysis accordingly, so that percentages are adjusted for missing values, we will use the word “missing” with the tabulation command.
The following command will be used
tab1 q4,missing
Now the table shows the values adjusted for missing values with relevant details of percentages.
Related Article: Using different types of t-test in stata
Remember that we are essentially interested in finding the percentages of valid responses of variables in descriptive statistics in Stata. So for that purpose, we can use another approach to find these percentages. To find percentages of those valid responses, first install a user written command:
ssc install fre
Once the function has been installed, we assume that variable q1 and q4 have missing values, and we only need to find percentages of valid responses. So the following command is used
fre q1 q4
The results that we got from using above command explains how the valid percentages for variable q4 are calculated using fre command. As the q1 variable doesn’t have any missing values, so the result of q1 variable is essentially similar to original result we got by using tab command.
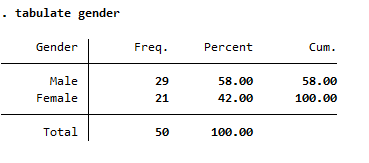
The variables in Stata are also labeled into numerical values as 0, 1, 2 and so on. So, for instance, in our data, a variable named gender, has two categories, Male and Female. These two categories also have value number as 1 and 2. If we want descriptive statistics of gender, and need to find out percentages of male and female, the simple tab command used with the name of variable.
tabulation gender
This will generate the results of male and female percentages as shown in the picture below.
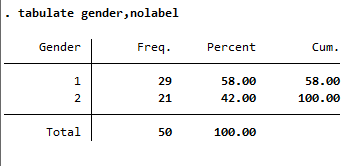
However, for the sake of data analysis in summary statistics, if we need value number of the categories male and female, we can use the command tabulation with term nolabel to get value number of these categories.
The following command will be used
tabulation gender, nolabel
However, if we need both values and labels of categories of the variable, we can execute the following command and get category’s label and values.
numlabel _all,add
We can also verify the values of variables along with their labels in window editor command.
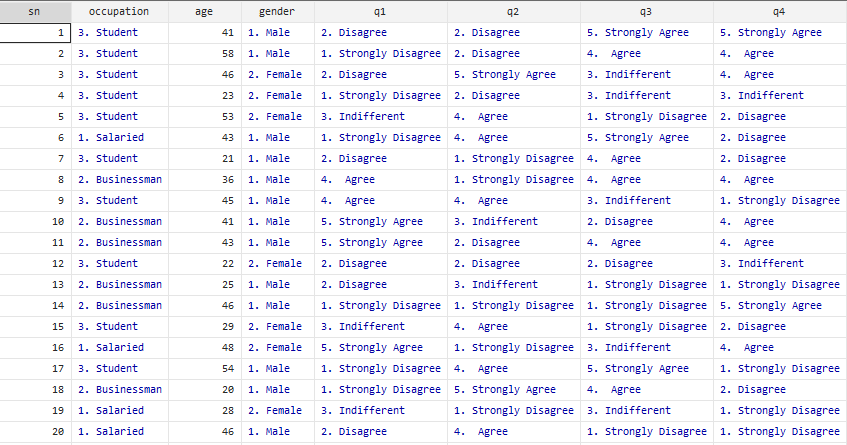
Now, by using the tab command, we can get both values and labels of the variable.
tabulation gender
Similarly, if we want the values of another variable, say q4, along with the gender variable, we can use the command shown below and get the following results
tab1 gender q4
If the data is required to be same as previous, we can also remove the values from variables using this command
numlabel_all, remove
This will remove the labels from the variables or categories.
Two Way Tabulation for Descriptive statistics in Stata
In above tabulation, we generated the separate tabulation of all variables whose frequency was required. However, if we need all these variables and their frequencies to be generated together, we can write these variables together along with the tabulation command. This way, Stata will generate the descriptive statistics of data in one table.
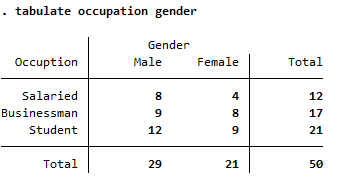
To find the descriptive statistics in stata, of gender and occupation, we will use the following command, and the result will provide us with details of occupation of both genders
tabulation occupation gender
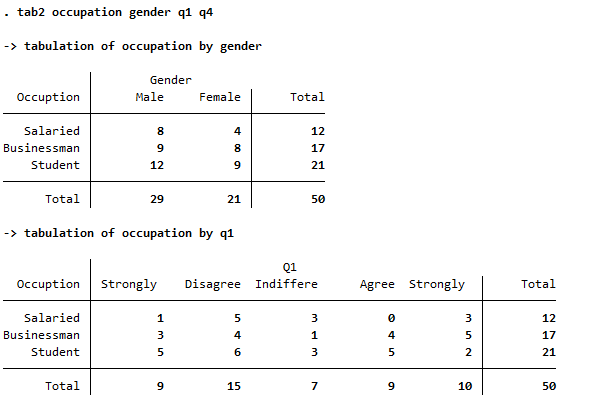
Similarly, if we need two-way tabulation for the variables we listed, in all possible different combinations, we use the following command
tab2 occupation gender q1 q4
This command will provide details of occupation by gender, occupation by q1, occupation by q4, gender by q1 and q4 and so on, all in separate tables.
Some of the tables are provided below. All possible combinations of different variables listen in the command are shown and all the details are provided corresponding to the relative variable.
The two-way tables can also be generated by windows using the following path
Statistics> Summaries tables and tests> Frequency tables>Two Way Tabulation
Pie Charts for Summary Statistics in Stata
If the graphs are required to be generated for Categorical variables, these graphs are easily generated through Stata. If we are dealing with continuous variables, probably the charts in demand will be line charts, however, for categorical variables, pie charts are more feasible.
To generate pie charts through menu window, click on
Graphs> Pie Chart >Graph by Categories
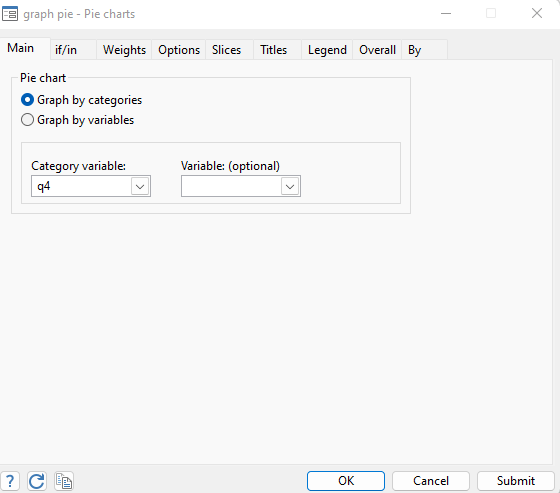
Note that in Pie chart window, there are two types of options. The first option, that says graph by categories, is used when our data is divided in categories, as in this case, where we have data available in different categories. The second option is graph by variables, where data is provided in variable form. We chose the first option, because our data is divided in categories, i.e. variable gender has two categories, male and female, and so on.
So if we wish to generate a pie chart for “q4” we will drag down the q4 variable and click on submit button. The following graph will be generated
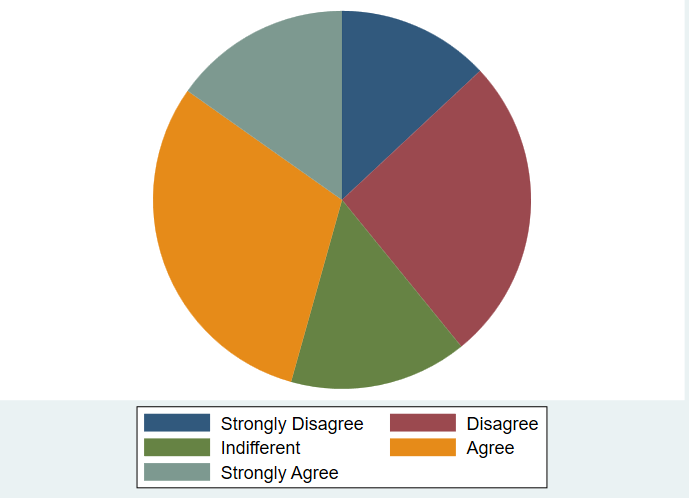
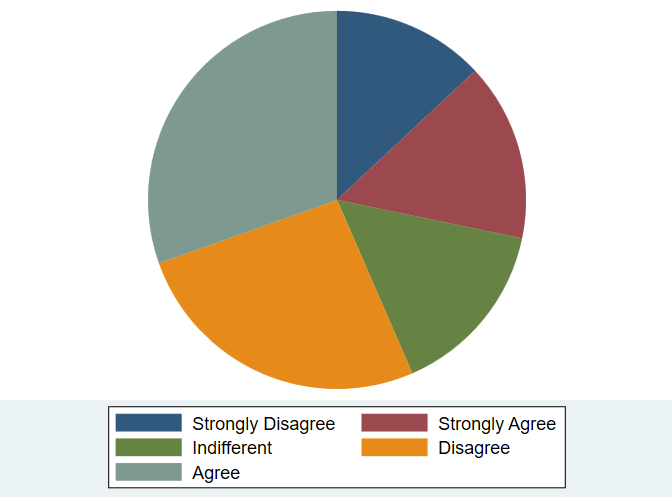
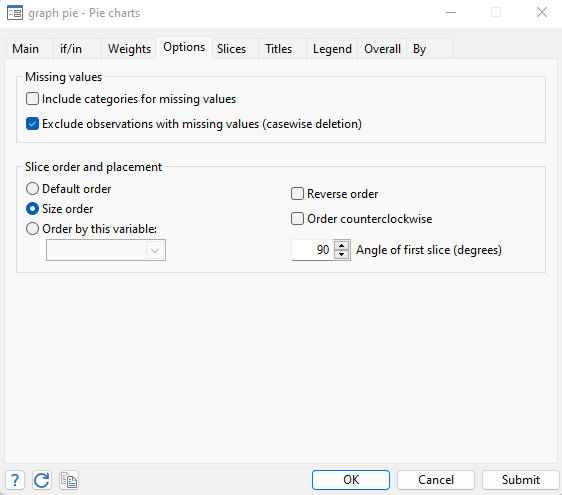
As visible, this is the randomly drawn graph and doesn’t follow any sorting. If we want to sort the graph, we will go in “option” window and choose the Size order option. By clicking on submit button, the following graph will be generated which follows an order. The order is such that smallest pie is at first, followed by increasing pies.
Related Article: Combine multiple graphs in Stata
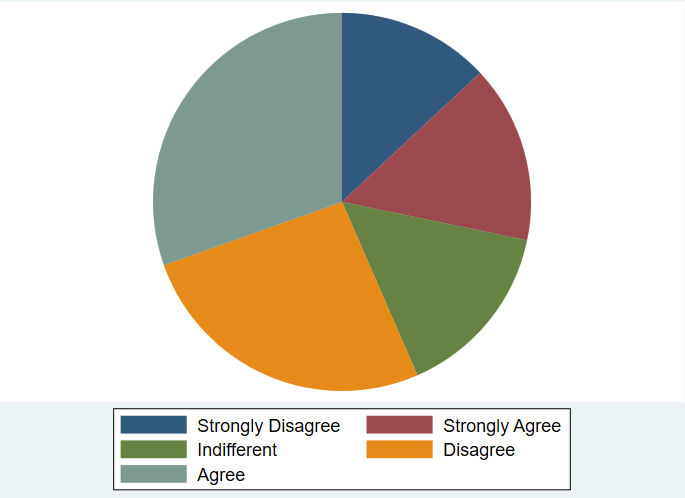
Similarly, we want to exclude the missing observations, to avoid any disruption in data. To do so, we click on the option of excluding observations with missing values in Pie Chart window, as shown below
This will generate a new Pie chart where missing observations are not included. The new graph will be different from previous ones
Apart from manually generating a pie chart through menu window, we can also generate pie chart by using the command below. Through this command, we can generate a graph whose pies are in order and not randomly drawn.
graph pie, over(q4) cw sort(q4)
Creating Bar Chart for Categorical Variables
Similarly, we can generate a bar chart from Stata, for categorical variables. Now while generating bar chart in Stata, we come across different type of options, which we can use as per the requirement. However, in descriptive statistics we are interested in getting frequencies or percentages, we will chose the relevant option. To do so again, use the following path
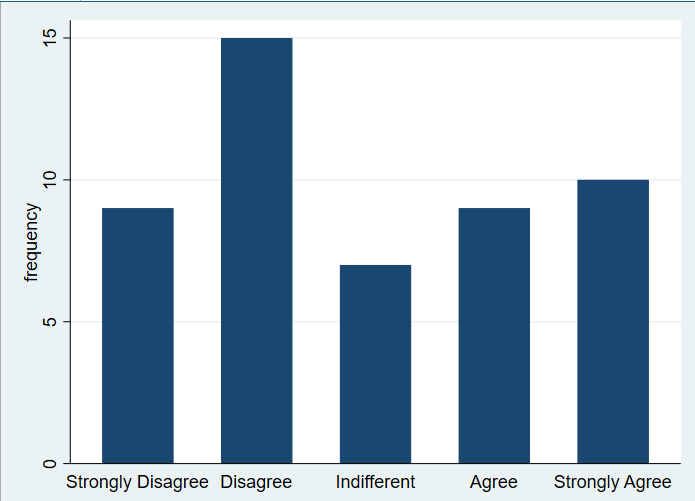
Graphs > Bar Chart > Graph Chart with frequencies > q1
Remember, q1 is the variable for which Bar Chart is required.
The following graph will be generated by using the path mentioned above
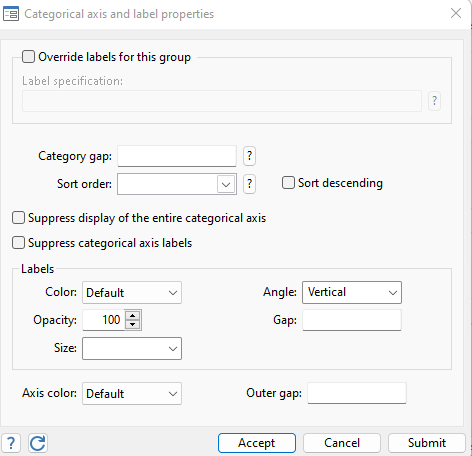
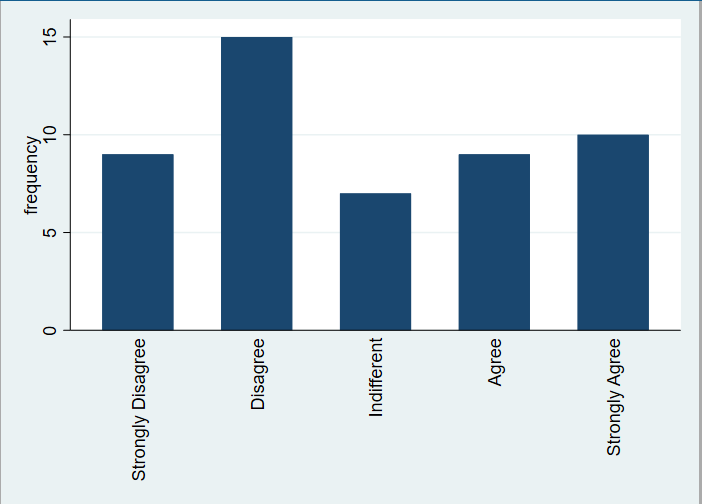
We can get different formatting and design of Bar chart using different built-in options. For instance, if we want to have names of categories written vertically instead of horizontally, we will use the “vertical” option in window.
The names of categories or labels of categories will now appear vertically in Bar chart instead of horizontally. This is shown in image below
Related Article: How to Create A Histogram in Stata
Instead of creating bar charts through menu window, we can also generate the bar chart using the following command
graph bar (count), over(q1)
Similarly, if we want to specify certain instructions for the labels, we can add those instructions in the command. We can also change the sizes of labels or names of categories. To do so, use the following command
graph bar (count), over(q1, label(angle(forty_five) labsize(small)))
We have given instructions related to angle of label of graphs and how size of the text should be formatted. Newly generated graph will follow the instructions.
… [Trackback]
[…] Informations on that Topic: thedatahall.com/descriptive-statistics-in-stata-and-tab-command/ […]