In this article, we will learn about calculating descriptive statistics (rolling mean, median, standard deviation etc. in Stata) and rolling beta using a command called rangestat. If you have not installed this command, you can install it by using the following command in Stata:
Download Example Filessc install rangestat
You can check all its functions using the help command in Stata:
help rangestat
This help window will appear:

As you can see above, it has two types of statistics, i.e. stat and flex_stat. stat is for simple, mostly used descriptive statistics like rolling mean etc., and flex_stat is for regression, correlation etc. in Stata.
As in the previous article, we calculated Rolling Beta using asreg. So let’s now start with calculating Rolling Beta using rangestat. Asreg could only run rolling regression but rangestat can also do rolling mean, kurtosis etc. as given in above picture.
Using rangestat to calculate Rolling Beta in Stata:
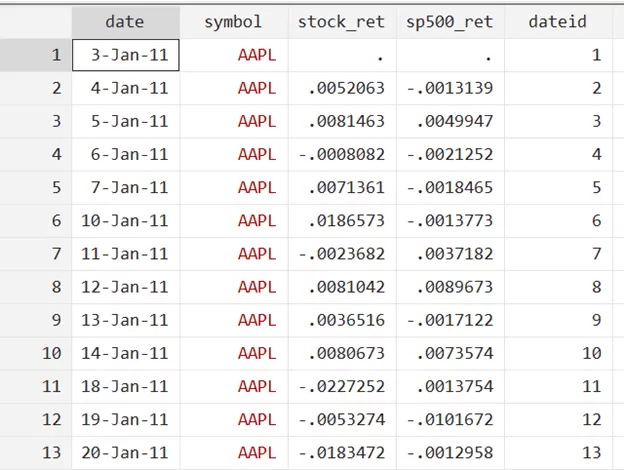
In our dataset we have two variables i.e. stock return and market return. It is a panel data containing different stocks. We will first demonstrate rolling regression, for that we use the following command in Stata:
rangestat (reg) stock_ret sp500_ret, interval(date -30 0) by(symbol)
Starting with rangestat command, we wrote reg for regression as we need to calculate regression, followed by the variables for which regression is to be calculated. In this case, they are stock returns and market returns. Then we need to set an interval for regression, in this case 30 days. At last, as we don’t want to overlap values for all four companies, it will calculate the regression by taking the symbol as a reference, therefore we use by(symbol) option.
We will get the following results:
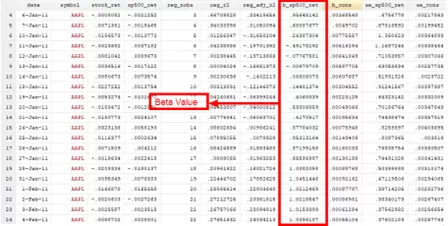
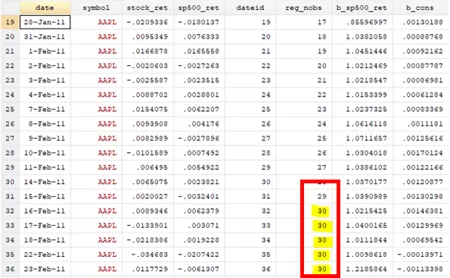
As you can see above, the command generated a rolling beta value for an interval of 30 observations as set. Other values are also generated, including, adjusted, beta constant, and standard error of regression coefficient and constant.
Trading window VS Calendar window
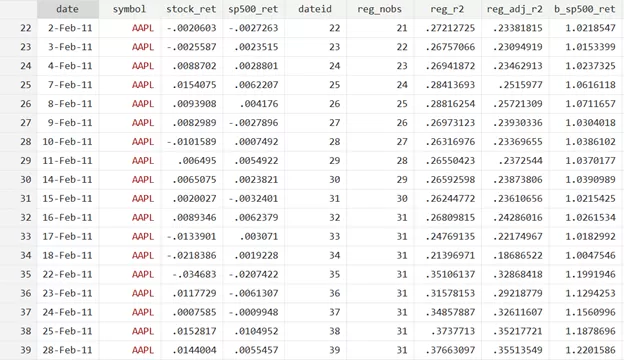
As you can see from above picture, the 5th column (reg_nobs) represent the number of observations that were included in a specific regression. It should had been 30 right? Because we have set the interval at 30, but the maximum value we see is 22 number of observations. The reason for this is that rangestat is using the date variable in interval and there are holidays in them, these are called calendar dates. So rangestat is taking 30 calendar dates lets say from 1st of Jan till 1st of Feb, but within this time period stock market was open for say 22 days hence we have 22 observations.
To resolve this, we can do trading days instead of calendar dates. So let’s create a new variable called dateid
by symbol : gen dateid=_n
It will assign a serial number to each date:
Now if we execute the same rangestat command but instead of date variable we use dateid variable:
rangestat (reg) stock_ret sp500_ret, interval(dateid -30 0) by(symbol)
Now you can see from the reg_nobs column that we have 30 observations. You would also see rows where we have less number of observations, and that is a limitation of rangestat. We can easily drop these lower number of observations.
Related Article: Stata Command Modifiers if, in, by, bysort Qualifiers and Statements in Stata
drop if reg_nobs<31
Excluding the current observation from analysis
One thing to note from the above picture is that we are getting 31 maximum observation instead of 30 observations as defined in the interval. The reason for this is that it is including the current observation in the analysis. We can exclude that using either of following methods.
Using -1 instead of 0:
The first option is to use -1 as upper limit instead of 0 as it will take one previous value but not the current value.
The command can be altered as:
rangestat (reg) stock_ret sp500_ret, interval(dateid -30 -1) by(symbol)
Using exclude self option:
The second option is to exclude the self-observation options, which is excludeself. So above command can be altered as:
rangestat (reg) stock_ret sp500_ret, interval(dateid -30 0) by(symbol) excludeself
We will get the following result:
You can also check for other interval options for forward and backward-looking window as below:
Interval (year -5 0)
Interval (year -5 2)
Interval (year 0 4)
Interval from a variable
We can also set these intervals from a variable. Let’s generate two new variables:
gen lower_lim = 0.5*_n
gen upper_lim = 1.5*_n
The above two will make lower and upper limits which change with each observation as they have different values for each day and is changing continuously.
Now, the mean command will be:
rangestat (reg) stock_ret sp500_ret, interval(stock_ret low high) by (symbol)
You can try it on your own to see the difference in results for all calculations.
Please note that if there is any missing value in data for regression, covariance and correlation cases, then the command will skip that entire row and not include that in the calculation i.e. casewise deletion will come into play.
Using rangestat Command to Calculate Mean in Stata
Like Rolling Beta, we can calculate for Rolling Mean also in Stata. We just have to replace reg option with mean option in Stata as:
rangestat (mean) stock_ret sp500_ret, interval(dateid -30 0) by(symbol)
We will have the result as follows:
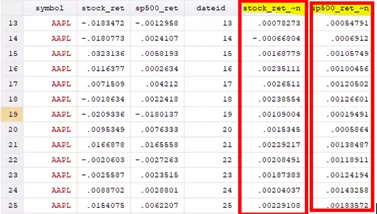
As you can see above, it calculated mean for stock return and market index return values.
Using rangestat Command to Calculate Median in Stata
Like mean, we can also calculate median. For this purpose, we just have to write median instead of mean. The command for this in Stata will be:
rangestat (median) stock_ret sp500_ret, interval(dateid -30 0) by(symbol)

As you can see, it has calculated median for both stock return and sp500 index.
Related Book: Introductory Econometrics for Finance by Chris Brooks
Using rangestat Command to Calculate Multiple Statistics in Stata
Instead of calculating one by one for each statistic, we can use the rangestat command to calculate multiple statistics simultaneously. So let’s calculate mean, median, sum and observations all together using just one command.
That all in one command is given as:
rangestat (mean) stock_ret sp500_ret (median) stock_ret sp500_ret (sum) stock_ret sp500_ret (obs) stock_ret sp500_ret, interval(dateid -30 0) by(symbol)
You will see the results as:
It calculated all mean, median and no. of observations all at the same time. Interval is same to 30, and it is done by symbol to prevent overlapping.
As you can see, there are difficult names for each output. We can assign a new name to these variables also. We can write the above command as:
rangestat (mean) mean_stock= stock_ret mean_sp500= sp500_ret (median) median_stock = stock_ret median_sp500 = sp500_ret (sum) sum_stock = stock_ret sum_sp500 = sp500_ret (obs) nos. stock = stock_ret nos_sp500= sp500_ret, interval(dateid -30 0) by(symbol)
As you can see in the below, output name has been changed according to the names in command.

You can use this to rename if you wanted.
Using If Qualifiers by rangestat in Stata
If qualifier is a conditional option to implement on some specific data portion according to need.
Let’s say I want to calculate mean for only one firm i.e. Apple, then this can be implemented by using the following command:
rangestat (mean) stock_ret if symbol == “AAPL”, Interval (dateid -30 0)
In above command if conditional is used for symbol, that if symbol value is equal to AAPL then it will calculate the mean; otherwise, it will continue checking till the end. If it finds that symbol matching, then it will start figuring it.
We have the results below:
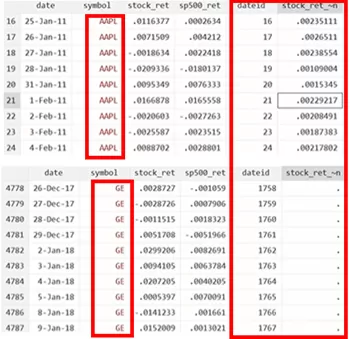
In above pictures, you can see it only calculated for AAPL instead of anyone else.
Using In Qualifiers by rangestat in Stata
In Qualifier will calculate anything for a specific range of values. The in qualifier in Stata can be used to perform commands on certain rows/observations.
Let’s say, we want to take mean of first 500 observations only. We can use the following command in Stata to implement In qualifiers:
rangestat (mean) sp500_ret in 1/500, interval(dateid -30 0) by(symbol)

The above results show that it calculated for only the first 500 and does not calculate the mean for afterward. It can be used to act on a specific observation.
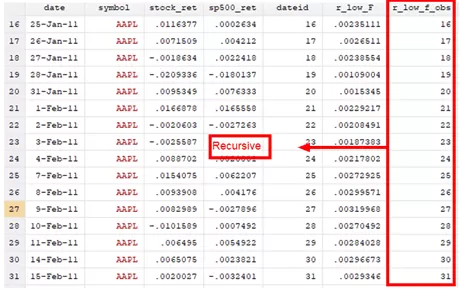
Calculating recursive and reverse recursive Window using rangestat in Stata:
As previously, we calculated for recursive and reverse recursive using asreg; we can also calculate it using rangestat by using following commands:
For recursive window:
rangestat (mean) r_low_F=stock_ret (obs) r_low_f_obs =stock_ret, interval(dateid . 0) by (symbol)
For reverse recursive window:
rangestat (mean) r_low_F=stock_ret (obs) r_low_f_obs =stock_ret, interval(dateid 0 .) by (symbol)
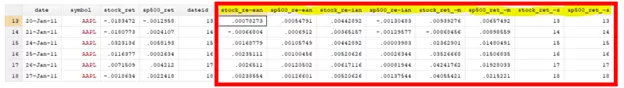
The concept is the same as the previous one. You can use the above commands to get values for recursive and reverse recursive as:

You can also try other functions like sd for standard deviation and corr for correlation.
Using describe Option to Describe Variables
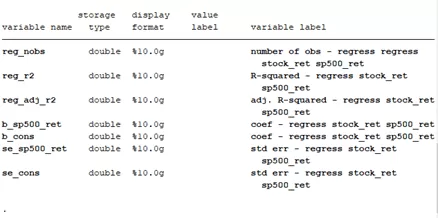
We can also describe the above variables by using describe option at the end of rangestat command in Stata as:
rangestat (reg) stock_ret sp500_ret, interval (date -30 0) by(symbol) describe
We will get the following result: