Tidyverse package can summarize data using the summarize function in R. This function provides the summary statistics of data and creates aggregated results from the data set. It generates the summary statistics based on a certain category of the data and/or the summary of data without any category.
To learn how does the summarize function works in R, we first load the tidyverse package from the following command in R.
Download Example Filelibrary(tidyverse)
Next, load the data set named diamonds from the command given below.
data (diamonds)
This loads data set on diamonds from the web source, and data has 53940 observations of 10 variables named color of the diamond, its cut size, and shape of the diamond etc. The data is visualized as below
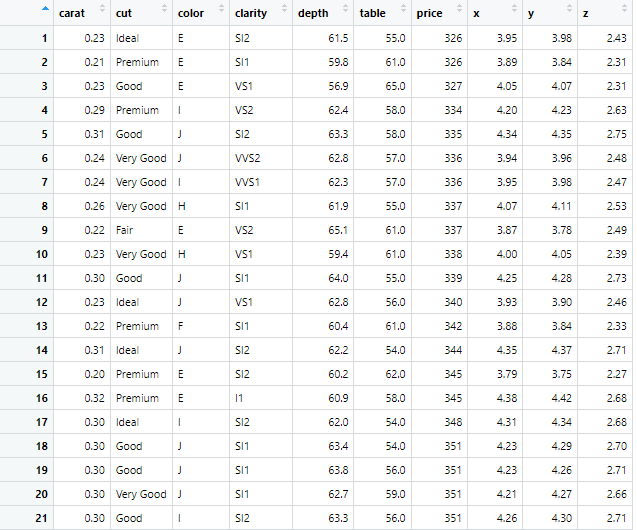
The variable of our interest in the above data is Price variable, and how the price of the diamond changes with the change in other variables like cut size and color etc.
Calculating average of a variable using summarize function:
If we are interested in calculating the average of a variable, say Price, the summarize function is used for that. The summarize function will be used in the following way for finding out the mean price
A1 <- diamonds %>% summarize("Average_Price" = mean(price))A1 is the name given to the average price that would be generated by using the summarize function in the above command. The average price is calculated from the mean of the price variable.
The mean of price calculated is as following

Similarly, if we want median of the variable, the following command will be used to find the median from the summarize function.
A1 <- summarise(diamonds,"median" = median(price)
Note that difference between these two commands is that one has name of data set to be used at the start, and then it is linked with the rest of the command using pipe operator (%>%). In the second command, the name of data set is written after the summarize function. Both commands are correct and can be used.
Summary Statistics by the category using Summarize function in R
Till now, we calculated the mean and median of the price variable individually. But that doesn’t give a significant meaning of the calculations. However, if we want to find the summary statistics, or mean or median of the variable using different categories, of a variable summarize function can do that. If the mean or median price of the diamond is to be calculated by the cut of the diamond, or how different cut of diamond can affect the price, group_by function will be used in the command. The group_by function will group the data set based on the cut variable, and then mean of the diamond price is calculated. The command will be as follows
A2 <- diamonds %>% group_by(cut) %>% summarize("Average_Cut_Price" = mean(price)) %>% ungroup()The mean price based on the cut of the diamond is as following
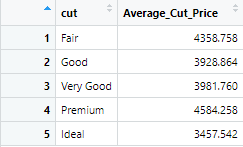
As the cut is the categorical variable, the mean price of each of the category of the cut variable will be calculated, as shown in the image above.
Ungroup the data set:
In the above command that we used, there is a function of the ungroup() in the command. This function is necessary to instruct R not to use the grouped data for the next commands. For instance, if we group a diamond data by using the following command
diamonds <- diamonds %>% group_by(cut)
The data will be grouped based on the cut variable, although there wouldn’t be any apparent changes in the data appearance or change in number of observations or number of variables in the data set.
However, for the the future commands, R will remember that data set is grouped by the cut variable, so it will perform all the commands based on this grouping. Now, if we calculate the average price of diamonds, using the summarize function in R, the mean price will be calculated based on the cut variable’s categories.
The command will be as following
A1 <- diamonds %>% summarize("Average_Price" = mean(price))Note that, in above command, we didn’t use the group_by function to calculate the mean price based on cut variable. However, results generated from the above command, shows the mean of price is calculated based on the grouping of variable.
Thus, it is important to ungroup the variables by using the ungroup function in R.
Calculating Summary Statistics based on Multiple Groups
Summary statistics or mean or median of a variable can be calculated based on the multiple groups in the data. This can be done using the group_by function as used earlier, with the multiple variables. The mean price of a variable then calculated will be based on the categories of those multiple variables. If we want to calculate mean of the price of diamonds based on the cut and carat of the diamond, we will use the following command
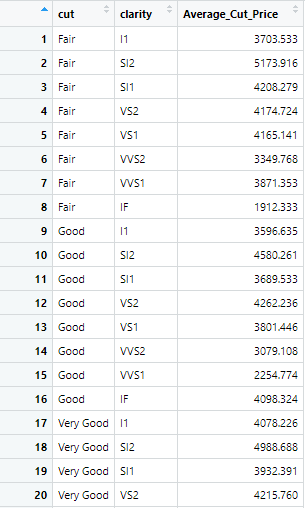
A2 <- diamonds %>% group_by(cut,clarity) %>% summarize("Average_Cut_Price" = mean(price))The following summary statistics of the price variable based on the cut and clarity is calculated
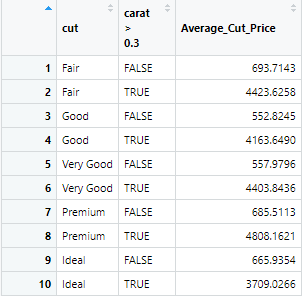
Similarly, if we want multiple grouping and set a certain range or criteria for a variable on which grouping should be done. For example, if we want the mean of the price based on cut and carat, but the grouping criteria for carat is that carat’s value should be greater than 0.30, then command will be executed accordingly. The command will be as following
A2 <- diamonds %>% group_by(cut,carat > 0.30) %>% summarize("Average_Cut_Price" = mean(price))The results generated from the above command are as follows
Multiple Statistics from the Summarize Function in R :
Multiple statistics can be calculated from the summarize function in R at the same time. The mean and median, or minimum and maximum values or any combination of the summary statistics can be generated from the summarize function.
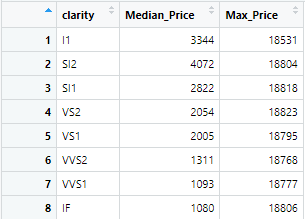
For example, if we want to calculate median and maximum price of the diamonds, based on the clarity of the diamond, we use the following command
A3 <- diamonds %>% group_by(clarity) %>% summarize("Median_Price" = median(price), "Max_Price" = max(price))The following results are generated for the prices of diamonds based on different categories of clarity of the diamond.
Calculating Number of observations:
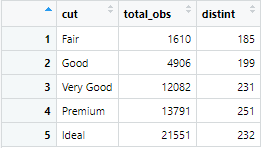
The number of observations present in a variable can be counted using the summarize function in R . For example, if we want the number of observations for the category or group of a variable i.e. cut, and we also need unique values of the variable carat within each group or category of the cut variable, then following command will be used
A4 <- diamonds %>% group_by(cut) %>% summarize(total_obs = n(), distint = n_distinct(carat)
The above command generates the following results. As shown below, the number of total observations and distinct observations of carat variable are calculated for the category of the cut variable.
Summarize all variables:
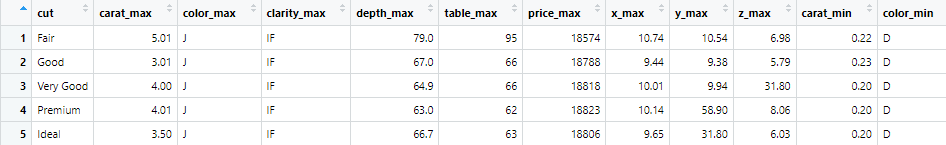
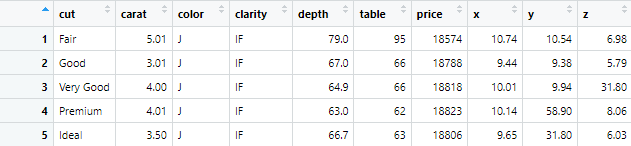
If we want all the variables to be summarized, based on a certain grouping, the summarize function in R will be used. In this data set, if we summarize data based on the cut variable and the maximum values should b calculated, then the following command will be used
A4 <- diamonds %>% group_by(cut) %>% summarize_all(max)
The maximum values of all the variables based on the cut variable will be calculated as following
Similarly, the summary statistics of all the variables, i.e. maximum and minimum, and mean value of all the variables, are calculated from the following command.
A4 <- diamonds %>% group_by(cut) %>% summarize_all(funs(max,min,mean))