In R, one can filter rows present in data set using various functions and packages. Rows can be filtered in the R using filter function, and Columns can be filtered using select function. In this article, we are going to use tidyverse package to filter rows.
Starting with it, set the working directory of the session where data set is saved. Next install the tidyverse package, in case you haven’t installed the package and then run the tidyverse library using the following commands
Download Example Fileinstall.packages(tidyverse) library(tidyverse)
Next load the data set in R using the following command
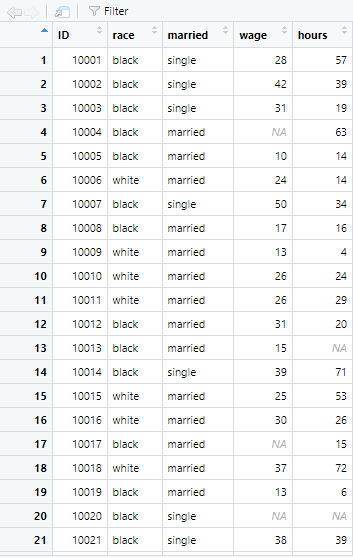
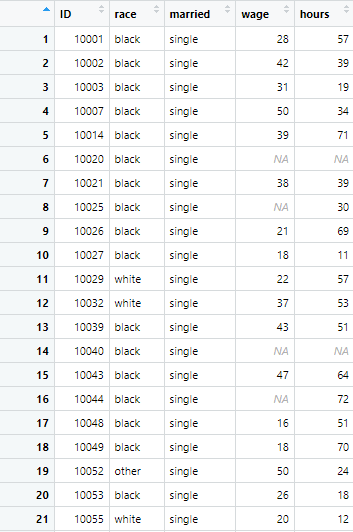
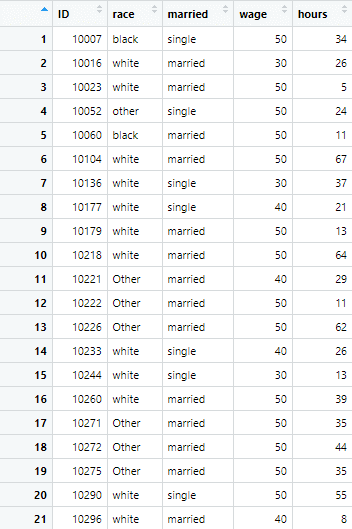
example_data <- read.csv("Example data.csv")The data looks as following, having different variables named race, married, wage etc.
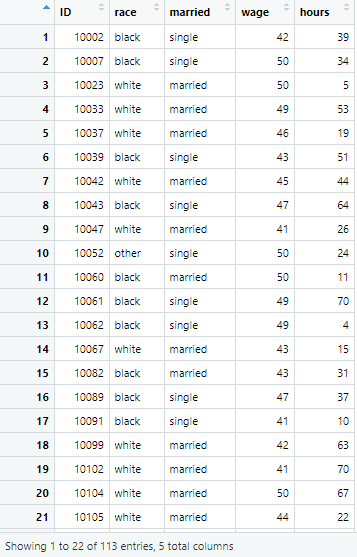
As our goal is to filter rows, having certain characteristics, we use the filter function to filter these rows. For instance, in the following command, the rows having wage greater than 40 in example_data will be filtered. The filtered data with wage above 40 will be named wage_40_plus
wage_40_plus <- example_data %>% filter(wage>40)
The new data set has 113 observations, where the wage is above 40.
Similarly, if we want to filter those rows having wage less than 40, we filter the data set using the command below, and name the filtered data wage_40_less
wage_40_less <- example_data %>% filter(wage<40)
The data set looks like following, with 370 observations having wage less than 40.
The thing that differentiates both commands is greater (>) and lesser (<) sign, instructing R to filter respectively.
Just like we filtered rows greater than and less than 40, we can filter rows with greater than or equal to 40 and less than or equal to 40, with minor changes in the command. For this purpose, the equal sign will be used with the greater sign. Thus, the following command will be used
wage_40_plus_equal <- example_data %>% filter(wage>=40)
Similarly, if goal is to filter rows where the filtered data has observations with wage equal to 40 or greater than 40, we use the following command
wage_40_less_equal <- example_data %>% filter(wage<=40)
The equal sign should come after the greater or lesser sign in the commands.
Equal to:
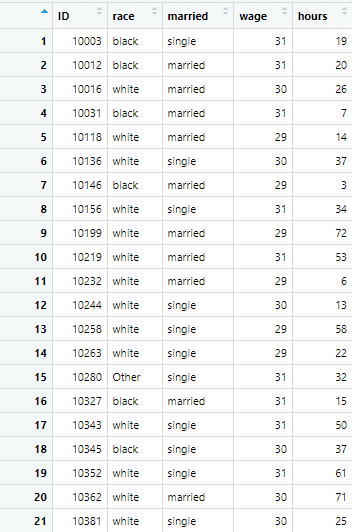
If the requirement is to filter data having only certain observations across the variables i.e. wage of only single people, then the equal sign is used in the command to filter such data. The command will be as follows
wage_single <- example_data %>% filter(married==”single”)
The above command instructs R to filter data set in such a way that only wage of single remains after filtering out. As the observation “single” comes under the married variable, in above command, married = single is given as a requirement.
The command generates following results
Not equal to:
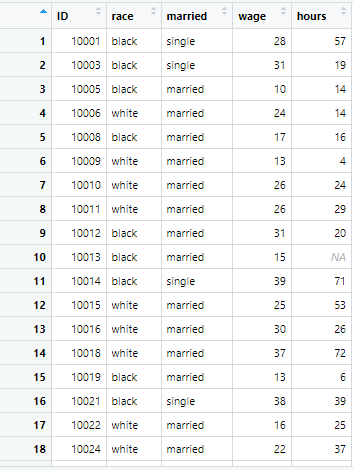
If the data requirement, on the other hand, says that we filter the data by not including certain observations in the filtered data, the exclamation mark is used with the equal sign. For instance, if data requires filtering wage of all except single people, then the command will become
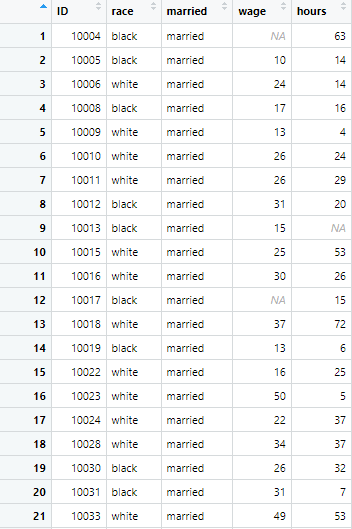
wage_married <- example_data %>% filter(married!="single")
The exclamation mark in the above command is instructing R to not include wage of single people in the data set. The filtered data is as following
Similarly, if you are required to filter rows where wage should not be above 40, then exclamation mark will be used with in the command to instruct R, that the wages above 40 will not be added to the filtered data. The command is as following
wage_40_not_plus <- example_data %>% filter(!wage>40)
Remember that if exclamation mark is added with greater sign, like filter(wage!>40), instead of filter(!wage>40), then R will give an error and command wouldn’t run. Thus, it is advised to look closely on the commands.
Filter Data with multiple options:
Till now, we have been using filter function where there is only option to filter the data. However, filter can be used with multiple options to filter data. Mainly and (&) , and or(|) functions are used to filter data when using multiple options. There are two cases for both of these:
If we want to filter rows where the individual is single in married variable and white in race variable , we need both conditions to be true. This will be the case of “and” option. However, in a case where we use “or” option, either condition can be true to fulfill the criteria e,g. individual can be single or white. Let’s take a quick look at how “and” and “or” work:
- Using “and” option
- If both conditions are true, it is considered true.
- In all other cases, whether a single condition is met or both conditions are not met, it is considered false.
- Using “or”: option
- Even if one condition is true, the overall condition is true.
- The only case where the condition is not true is when both conditions are false.
For instance, if the task requires you to filter data with only white and single people, filter function can be used with the (plus) & or comma (,) to filter data. The command will be as following
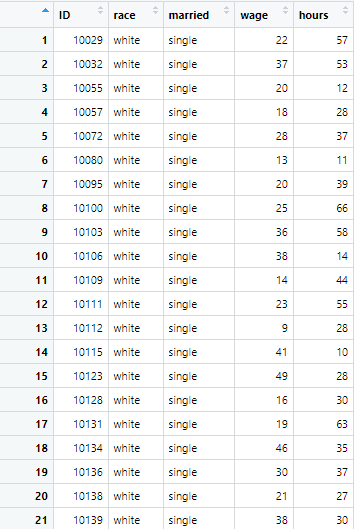
wage_single_AND_white <- example_data %>% filter(married=="single" & race=="white")
But what if you are required to filter data, where either the white people or single people are filtered, then the bar sign (|) is used in the command to filter either of the two options. The command is as following
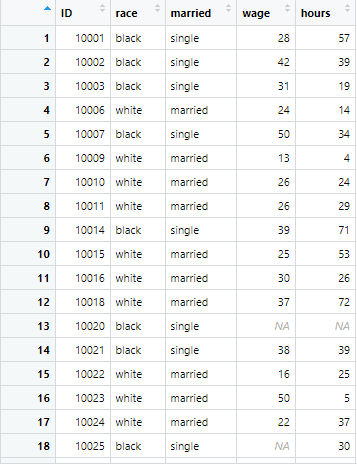
wage_single_OR_white <- example_data %>% filter(married=="single" | race=="white")
The following data set is generated
Continuing with the multiple option, if we have to filter the data, where wage is either equal to 30, 40 or 50, the filter function is used in the following way, with the bar sign
round_wage <- example_data %>% filter(wage==30 | wage==40 | wage==50)
This generates the filtered data having only wages equal to above numbers and not in between these numbers, i.e. 31 or 42 and so on wouldn’t be included in filtered data.
Now if you want to filter data which contain any of 30, 40 or 50 wage, then the command will have an additional %in% function in it. The command will be as following
round_wage_2 <- example_data %>% filter(wage %in% c(30,40,50))
The results of both of these commands is essentially identical.
Dealing with Missing Values:
If missing values are present in the data, they can be filtered out from the data too. Remember that missing values are represented by NA in the data, and the data here contains missing values too.
To filter these missing values from the wage and hours variables, if we use the filter function in typical way, as in the given command, it will give an error.
all_NA_values <- example_data %>% filter(wage=='NA' & hours=='NA')
The error will be as shown below
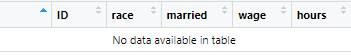
So the correct command for filtering out the missing values in wage and hour variable is as shown below.
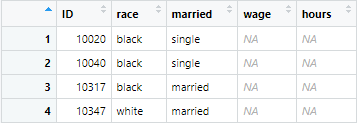
all_NA_values <- example_data %>% filter(is.na(wage) & is.na(hours))
Note that, in above command, we filtered the missing values by using is.na() function. The command will filter out missing values in the following way
If, for instance, we don’t want to include missing values in the data, and want them removed from data instead, the filter function can do this, along with the exclamation mark. The exclamation mark will not include the missing values present in the data. The command will be as following
wage_not_NA <- example_data %>% filter(!is.na(wage))
Between Certain Numbers:
We have discussed the filtering out of data greater than, less than, or equal to a certain number. However, there could be instances, where the data is required to filter out between certain numbers. For example, to filter the wage between 30 and 40, in this case. For this purpose, the filter function is used along with “between” option in R. The command will be as following
between_30_40 <- example_data %>% filter(between(wage,30,40))
The data set generated has 107 observations between the wage of 30 and 40.
We can also use the option “near” to a certain observation to filter data. The near option will filter observations close to near that observations which has been specified. The tolerance level can also be set, which would specify how close or near the filtered data should be to the specified observation.
For example, in this data set, if we set the near option close to 30 wage, and the tolerance level is 2, then the filtered data will have one above and below observations close to the 30th observation itself. So the filtered data will have 29, 30 and 31 observations in it.
The command for this is as following
near_30 <- example_data %>% filter(near(wage, 30, tol=2))
The following data set is filtered out.