Data cleaning is the most fundamental aspect of data analysis, ensuring the reliable and accurate results. Duplicate observations can, however, pose a challenge in this accuracy of data analysis, leading to skewed results. The handling of duplicate observations in R is a straightforward task, where the accuracy and reliability of data analysis can be ensured. This article deals with the three crucial aspects involved in managing duplicate observations in R; dropping duplicate observations, generating a report of duplicate observations, and tagging duplicate observations for further analysis.
Identifying and removing Duplicate Observations in R
First, we need to define that what duplicate observations are in R. Duplicate observations are identical observations that occur across the rows of a data set. The simplest way to handle duplicate observations in R is to remove those duplicate observations. The duplicated() function can be used for this purpose to drop the duplicates of observations.
To understand the duplicated() function further, let’s simply create a data set that contains duplicate observations. To create such a data set, use the following commands
df <- data.frame( ID = c(1, 2, 3, 4, 2, 5), Name = c("Alice", "Bob", "Charlie", "David", "Bob", "Eva") )In the above command, first we create a data frame of students having two variables ID and Name, representing IDs and names of students. Next, we identify the duplicate observations in the data frame. As seen from the above data frame, the name “Bob” is appeared twice, so our next goal is to drop that duplicate from the data frame. Before removing the duplicates, we first identify the duplicates by using the duplicated() function in R in the following way
duplicated(df)
Using this command, we get the following output, where FALSE shows the absence of a duplicate, while TRUE shows that a duplicate is present.

If the data set is large, and a lot of duplicate observations exist in a data set, we can use sum() and duplicated() functions together to count the number of duplicates in a data set. For example, in this case, both functions will be used in a command in the following way
#Count no. of duplicates sum(duplicated(df)) #Output #[1] 1
This shows that one duplicate exists in this data set, which is true.
Similarly, If you want to know the row indices or the number of row at which the duplicates occur, you can use the which() and duplicated() functions in combination to get that number of row. To get the row number, use the following command
which(duplicated(df))
The which(duplicated(df)) expression in the above command returns the indices of the duplicate rows in the data frame, and gives the following output.
# Row number where duplicate is [1] 5
Moving on, now we want to drop these duplicates. There exists more than one way to drop these duplicates in R. The first way is to use the unique() function in R. The unique() function in R is a function used to extract unique elements from a vector, matrix, data frame, or any other object. So when we use the unique() function in R, it will drop all the duplicate observations and keep only the unique observations in the data set. To use the unique() function in this case, we use the following command
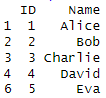
unique(df)
In the following output, the above command has removed the duplicate observations and only unique observations are preserved.
Another way to remove duplicate observations is using the distinct() function. The distinct() function is part of tidyverse package, and is used to select unique rows from a data frame based on specific columns/variables. To understand and use the distinct() function, first install and load the tidyverse package using the following commands
install.packages("tidyverse") library(tidyverse)The next step is to use the distinct() function in a command in the following way
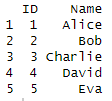
distinct(df, ID, Name)
In this example, the distinct() function is applied to the df data frame, selecting unique rows based on both the ‘ID’ and ‘Name’ columns. The resulting output will only contain distinct combinations of ‘ID’ and ‘Name’. The output is as following
The distinct() function is particularly useful when you want to obtain unique combinations of values in specific columns, ensuring that each row in the resulting data frame is distinct based on the specified columns.
Generating a Report of Duplicate Observations
It is often useful to have a summary or report of the duplicate observations in a dataset. To generate a report of duplicate observations, the duplicated() function can be used to get the information about the duplicates. To get areport of the duplicate observations, use the following command
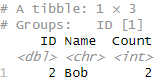
df %>% filter(duplicated(.) | duplicated(., fromLast = TRUE)) %>% group_by(ID, Name) %>% summarise(Count = n())
In the above command, duplicated(., fromLast = TRUE)) is used to identify duplicate rows, and then group_by() and summarise() from the tidyverse package are used to create a summary data frame with counts of each duplicate ID. We get the following summary for the duplicates
Tagging Duplicate Observations
Tagging duplicate observations involves adding a new column to the data frame to indicate whether each row is a duplicate or not. We can use the duplicated() function for this purpose. Let’s assume that we have a data frame named df, and we want to tag the duplicate observations, we can add a new column called ‘duplicate’ by using the following command
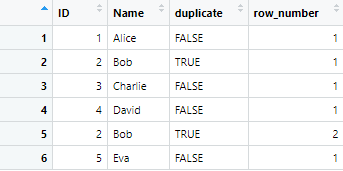
df <- df %>% group_by(ID, Name) %>% # Specify the columns to check for duplicates mutate(duplicate = n() > 1, # Tag duplicates row_number = row_number())
In the above command, the group_by() function is used to group the data frame based on the specified columns (ID and Name). Then, the mutate() function is used to create two new columns; duplicate (indicating whether a row is a duplicate) and row_number (providing a reference number for each row within its group). A column named duplicate will be added to our data frame, and each row will be marked as TRUE if there is a duplicate observation or FALSE if the observation is unique. The data will look like this