
Time series and panel are import data sets in certain fields of study like economics, finance, engineering etc. However, these data sets contain missing values, which can lead to biased or inaccurate results. Handling missing data is a crucial aspect of data analysis, particularly in time series and panel data settings where observations may be irregularly spaced or incomplete. In R, several powerful packages and functions are available to efficiently fill in these gaps, ensuring a continuous and complete dataset for further analysis. This article provides an overview of methods for filling gaps in time series and panel data using R.
Filling Gaps in Time Series Data:
Time series data represent successive observations collected over subsequent days, weeks, months or years. Time series data allows us to understand patterns and trends in a data set.
There are certain ways to miss these filling gaps of time series data using R. The first way is to interpolate data using the linear interpolation. The linear interpolation is a method to fill gaps by estimating the values based on before and after values of the gaps. To use the linear interpolation, first we create a data frame for time series data set using the following command
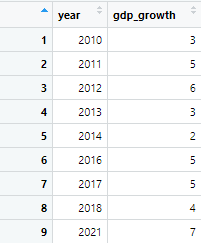
timeseries <- data.frame ( year = c(2010, 2011, 2012, 2013, 2014, 2016, 2017, 2018, 2021), gdp_growth = c(3, 5, 6, 3, 2, 5, 5, 4, 7))
This data set contains observations of GDP growth from 2010 to 2021, however, data for 2015, 2019, and 2020 is missing, as shown below
Now, before moving forward to the actual command, first load the tidyverse and zoo package, if you have already installed these packages. using following commands
library(tidyverse) library(zoo)
The zoo package, through its na.approx() function, enables the interpolation of missing values in the panel data, ensuring a more complete dataset for subsequent analysis.
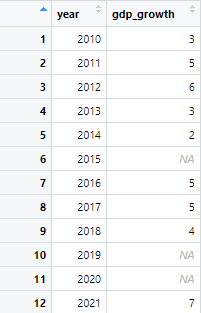
Next, we create sequence for years, starting from 2010 to 2021, and create the missing values in the above data set, using the following command
time_series <- data.frame(year = seq(min(timeseries$year), max(timeseries$year), by = 1)) %>% merge(timeseries, by = "year", all.x = TRUE)
In the above command, the first part of the command creates a data frame with a single column named “year”. It generates a sequence of years starting from the minimum year in the time series data to the maximum year, incrementing by 1 for each year. This ensures that we have a complete sequence of years covering the entire range of the original data. In the next part, merge() the function merges the time series data frame with the data frame created in step 1 based on the “year” column. It performs a left join (all.x = TRUE), ensuring that all years in the sequence created in step 1 are retained, even if there are no corresponding observations in the original time series data. This effectively creates missing values by aligning them with the complete sequence of years.
The data modified from the above command will look like following
Now, our goal is to fill these missing values, represented by NA. To fill these missing values, we use the interpolation, method as described above. The interpolation method uses the following command
time_series <- time_series %>% mutate(gdp_growth = na.approx(gdp_growth))
The command uses the mutate() function, which modifies the gdp_growth column by filling in missing values using linear interpolation with the na.approx(). The na.approx() will fill the missing value based on values above and below the missing value. The data with all the values filled will look like following
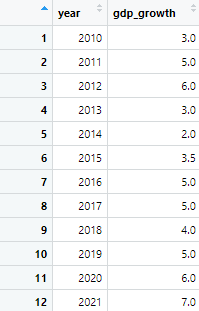
The time series data has no gaps now and can be used for further analysis.
Filling Gaps in Panel Data
Panel data typically consist of observations on multiple entities (e.g., individuals, firms, countries) over multiple time periods. To fill gaps in panel data using R, we can follow a similar approach as we did for time series data, but applied to each panel (or group) separately.
First, import the data set using the following command
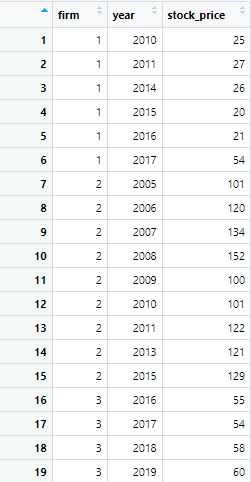
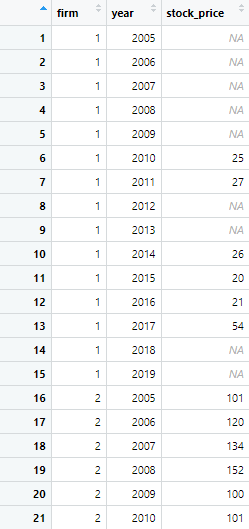
panel <- read.table(text = " firm year stock_price 1 2010 25 1 2011 27 1 2014 26 1 2015 20 1 2016 21 1 2017 54 2 2005 101 2 2006 120 2 2007 134 2 2008 152 2 2009 100 2 2010 101 2 2011 122 2 2013 121 2 2015 129 3 2016 55 3 2017 54 3 2018 58 3 2019 60 ", header = TRUE)
This creates the following data set.
Now, first we convert the panel data to tsibble object using the following command. A tsibble is a tidy temporal data structure that represents time series data along with other key attributes such as key columns and index.
panel_data <- as_tsibble(panel, key = firm, index = year)
The first function in the above command is to convert data into tsibble object. The next argument specifies which column in the dataset should be used as key columns in the resulting tsibble. In this case, firm is chosen as the key column, meaning that each unique firm identifier will represent a separate time series within the tsibble. Similarly, the next argument specifies which column in the dataset should be used as the index column in the resulting tsibble. The index column represents the time dimension of the time series. In this case, year is chosen as the index.
Now the next step is to identify the missing values in the data set, to fill these gaps. The default approach to fill gaps is to replace missing values with the default NA. We can do this using the fill_gaps() function in the following way
missing_panel <- fill_gaps(panel_data, .full =TRUE)
In the above command, fill_gaps() function is applied to fill in missing values in the time series data set. The data set will look like following
Although the missing values are replaced with “NA” and time series data is complete and ready for analysis without any gaps, not every data requires replacing missing values with NA, but would rather replace missing values with certain values based on the existing values. There are certain ways to replace NA with either the preceding missing value or the value succeeding it. To specify R to replace missing values with either the preceding or succeeding non-missing values, we can use fill() function in a command in following way
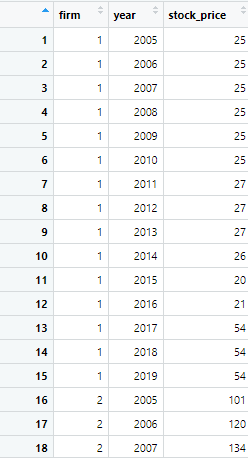
filled_panel <- missing_panel %>% group_by(firm) %>% fill(stock_price, .direction = "downup")
In the above command, first, we group the data by the ‘firm’ column. This ensures that filling of missing values is performed separately for each firm. The next part, fill(stock_price, .direction = “downup”) fills the missing values in the ‘stock_price’ column with the nearest non-missing value. This non-missing value can be either preceding or succeeding in each group defined by ‘firm’. That’s why both down and up function are specified in the argument. This command produces the following result
or you can simply use either the up or down function separately based on your preference. For instance, if you want missing values to be filled by the succeeding values (down values) only, you can use the following command.
downfill_panel <- missing_panel %>% group_by(firm) %>% fill(stock_price, .direction = "down")
Alternatively, you can also use the “up” argument.
Filling gaps in time series using tidyverse package
Although tsibble fills the gaps in panel data, there could be a simpler way to fill these gaps using the tidyverse package. In the tidyverse package, you don’t need to convert the data into a certain format, as we did earlier in tsibble. Given that we have already loaded the tidyverse package, we jump directly to creating the default NA values in panel data using the following commands
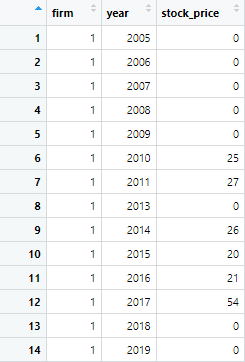
panel1 <- panel %>% complete(firm, year, fill = list(stock_price = NA))
The above command creates all possible combinations of the firm and year variables, ensuring that all combinations are represented in the output. It also fills any missing values in the stock_price column with NA. The output is similar to generated above
We can also specify a certain value to the missing value. The value could be any number, i.e. we are using 0 for the missing values. These values could be specified as following
filled_panel1<- panel1 %>% complete(firm, year, fill = list(stock_price = 0))
You can specify either value that’s suitable or as per requirements.