
It is a big obstacle to deal with missing values during data analysis. Missing values can occur for a number of reasons like skipped response, incomplete data entry, lost files, data malfunctions, etc. These missing values have consequences like biased analysis, model instability, incorrect inference, and loss of information, and they mostly reduce the statistical power or lack of precision. To handle these values, there are a number of ways. Let’s discuss some of them.
We will use the built-in `penguins ` dataset in R for a better understanding of these. This dataset contains information about various species of penguins, including measurements and observations. It is a widely used data set for analytics and visualization. Below is the code to load the dataset.
# Install and load required packages library(palmerpenguins) data("penguins") head(penguins) 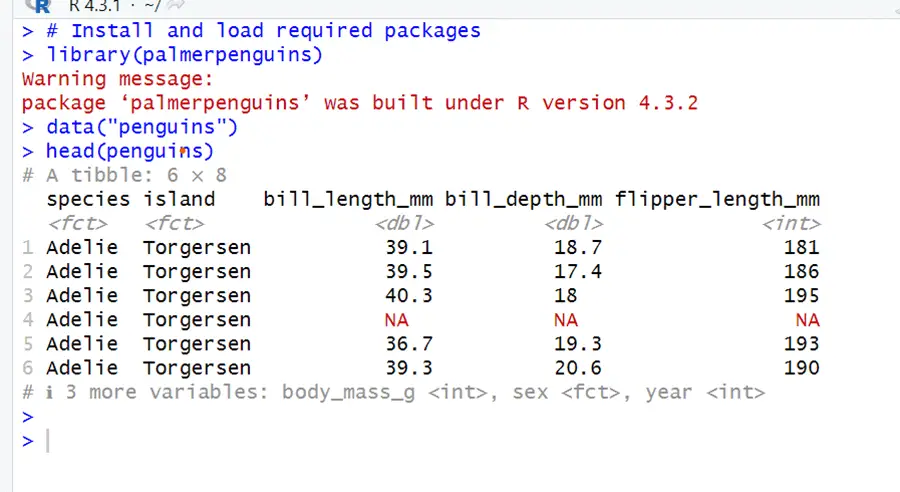
1. Identifying Missing Values:
To identify missing values in data using R, one can use the is.na() function. It will give results in the form of a vector containing TRUE or FALSE. TRUE represents the missing value, and FALSE shows the non-missing term. Below is the code for this function:
# Check for missing values in the dataset is.na(penguins) # Count the number of missing values in each column colSums(is.na(penguins))
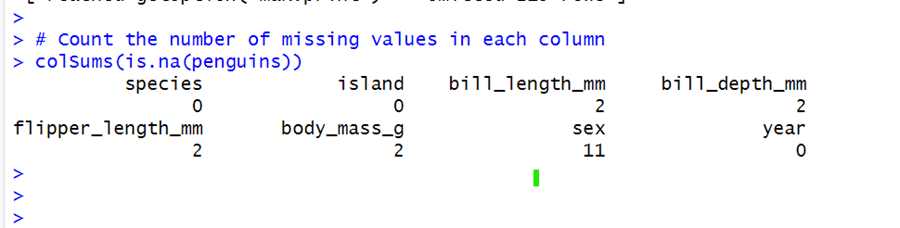
It can be seen in the output that there are 2 missing values in the bill length (length of penguin dorsal bill ) column, 2 in the bill depth (depth of penguins dorsal bill) column, 2 in flipper length (penguin flipper), 2 in body mass, and 11 in the sex column.
2. Removing Missing Values:
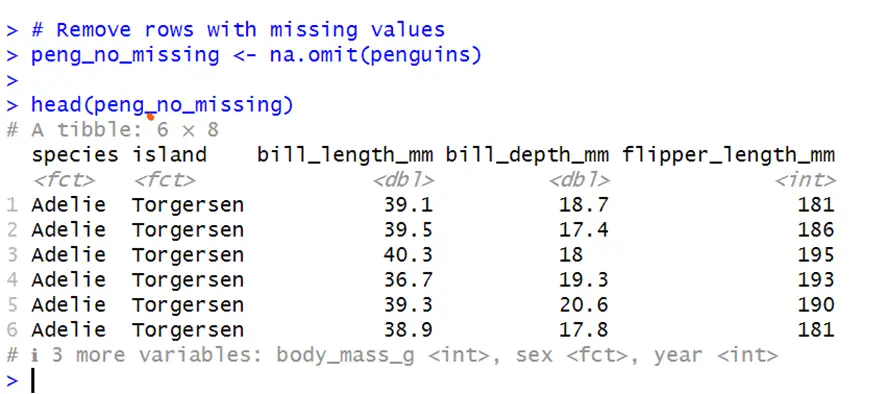
In R, we can use the na.omit() function to remove missing values from data. This function will remove all rows with missing observations from any variable. Below is the code for removing all rows with a single missing value in any column from the data.
library(dplyr) # Remove rows with missing values peng_no_missing <- na.omit(penguins)
3. Imputing Missing Values:
Imputation is a statistical procedure that uses different values in place of missing values. Imputation is important because we do not have the chance to remove cases with missing values every time. It substitutes the missing value with any other aggregate or available information. It makes the dataset more consistent and reliable by completing it.
- Imputation by pmm:
This method is used to fill the missing values on the basis of non missing values. In this process non missing values are filled withe predicted mean of some nearest observations.
install.packages(“mice”) library(mice) library(VIM) mice_plot <- aggr(penguins, col=c('navyblue','yellow'), numbers=TRUE, sortVars=TRUE, labels=names(penguins), cex.axis=.7, gap=3, ylab=c("Missing data","Pattern")) imputed_Data <- mice(penguins, m=5, maxit = 50, method = 'pmm', seed = 500) summary(imputed_Data)In the code above, penguins is the dataset, col is the color that will be plotted, numbers is used to add the percentages of missing values in plot, labels are the name of each column, gap is the space within the plot variables, ylab is a vector of labels at y-axis, c-axis is size of axis, sort Vars is true which will sort the variables in order to the missing values.
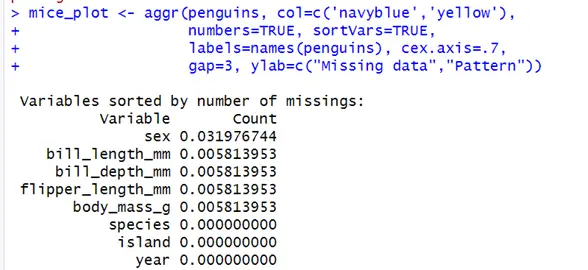
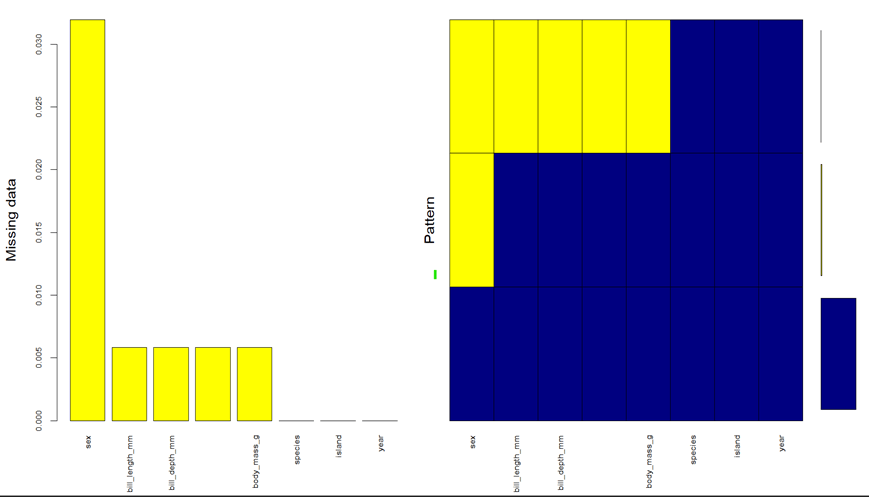
Above is the graphical representation of the data. The sex column has the most values missing. Bill length, bill width, flipper length, and body mass all have two values missing. Counts show the percentage of vales missing in the data. 3% of the data is missing from the sex column. And 0.5% from the remaining three columns.
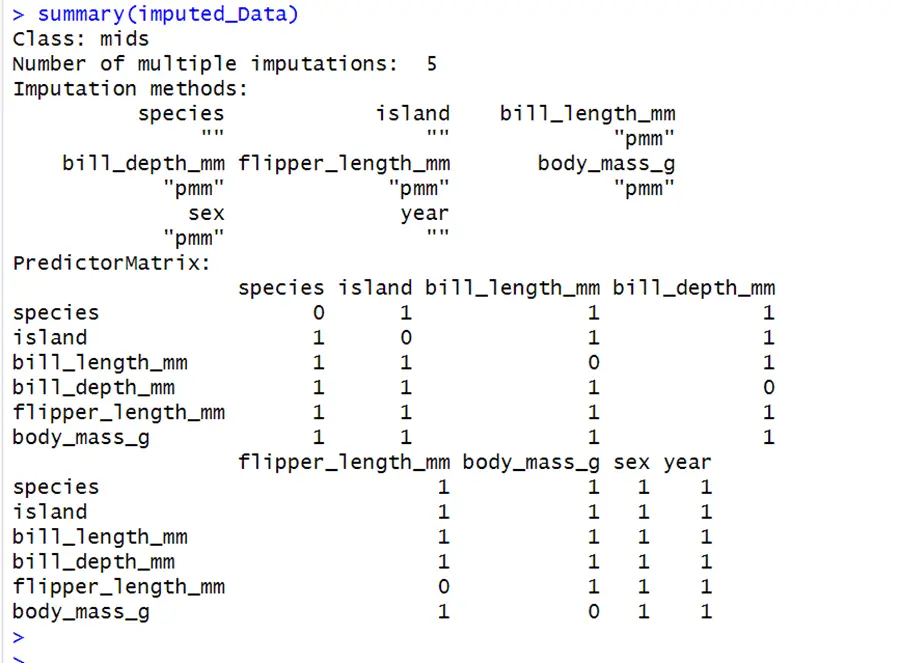
There have been 5 iterations of imputations with the predictive mean matching method used for imputing continuous variables. It creates a complete data set five times for incomplete data. Here 1 stands for the predictor variable and 0 stands for the response variable.
Imputation with mean:
By this technique, all the missing values will be replaced with the column mean in which they are existing.
Here’s an example of filling in missing values with means using `dplyr`:
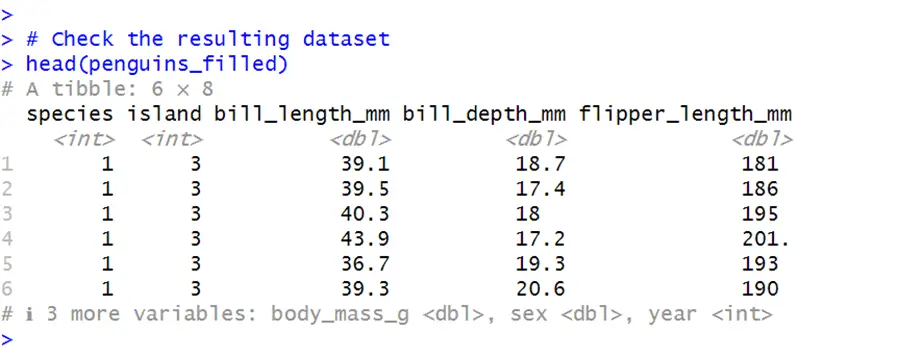
# Install and load the dplyr packages install.packages("dplyr") # Load the dplyr package library(dplyr) # Function to fill missing values with mean fill_missing_with_mean <- function(x) { ifelse(is.na(x), mean(x, na.rm = TRUE), x) } # Apply the function to each column of penguins penguins_filled <- penguins_with_missing %>% mutate_all(fill_missing_with_mean) # Check the resulting dataset head(penguins_filled)In the above code, the vector “fill_missing_with_mean” fills the all missing values in columns with their corresponding mean. Then this function is applied to all the variables using the “mutate_all” command.
4. Replacing missing values with next or previous value
In this method the missing values are replaced with either their previous or next values.
# Using zoo package for next/previous value imputation install.packages("zoo") library(zoo) # Impute missing values with next/previous value penguins_next_prev <- na.locf(penguins_with_missing, na.rm = FALSE) # Check the dataset with imputed values head(penguins_next_prev)In this code, missing values are replaced with the last non-missing value. na.locf() is from package zoo and is used for the imputation of last non-missing value to the missing value. na.rm is false because it will not remove the missing values from the data.
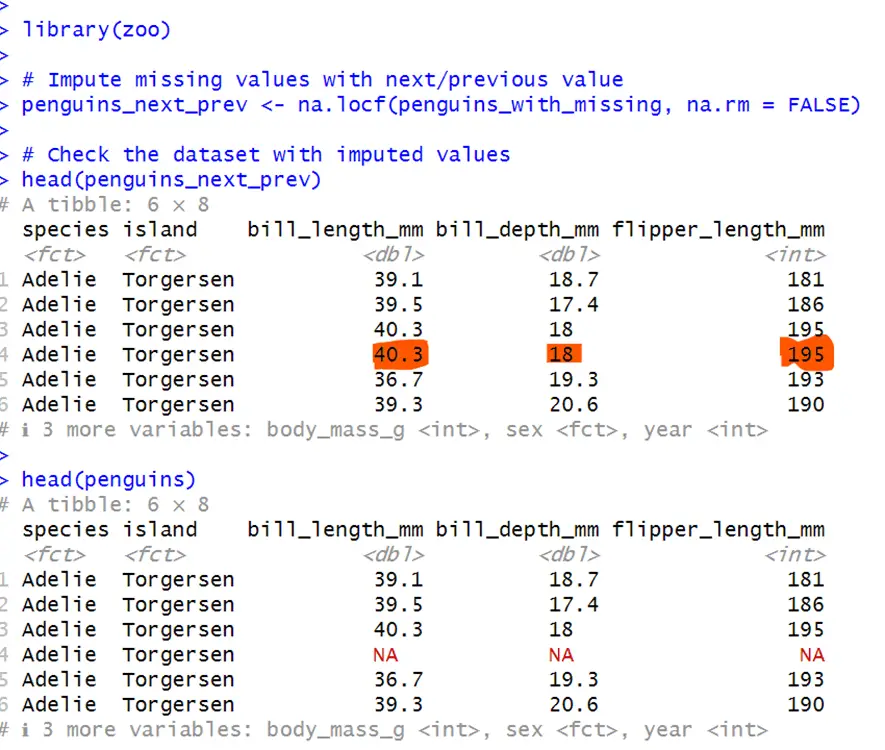
It can be seen that NA’s are replaced with previous values.
5. K-nearest neighbor
It is a highly used method to fill in missing values based on the specifications of the nearest points. Below is the code for the knn method.
# Using VIM package for k-NN imputation install.packages("VIM") library(VIM) # Impute missing values with k-NN penguins_knn <- kNN(penguins_with_missing, k = 5) # Check the dataset with imputed values head(penguins_knn)In above code for k nearest neighbor, kNN() function is used for imputation of missing values, where k is the number of neighbors to be consider for the imputation.
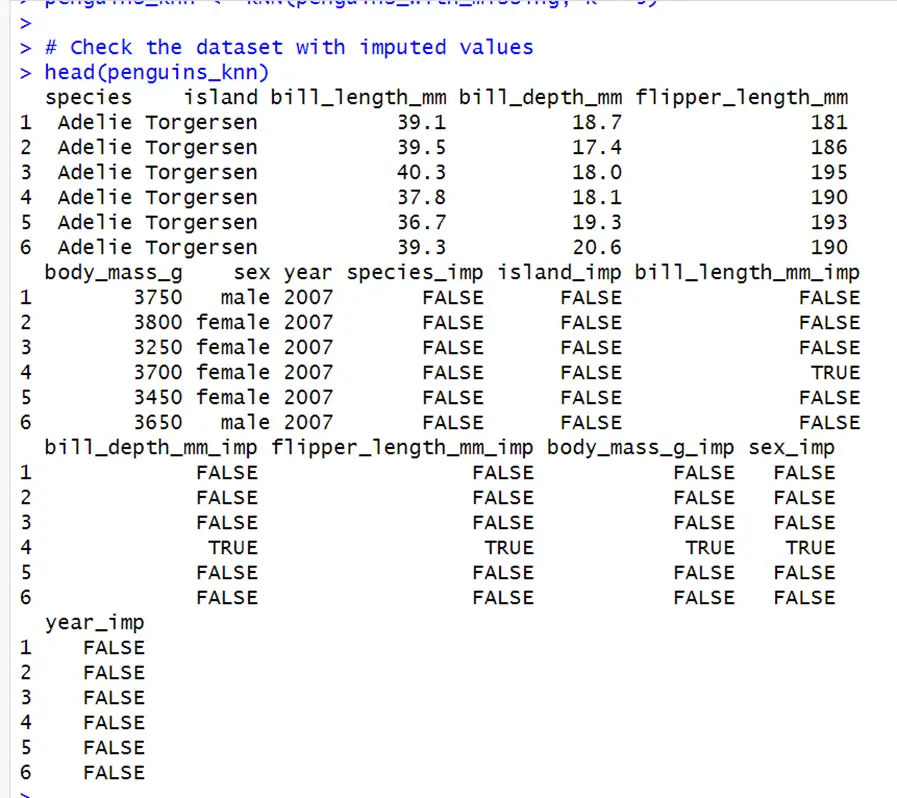
Here TRUE are the values that are imputed, and FALSE are those that are observed. Thus, this method successfully imputes the missing values.
6. The most frequent value
By this method, missing values will be replaced with the most frequent or maximum value of the corresponding columns. Below is the code for illustration.
# Load the necessary packages library(palmerpenguins) # Create a copy of the penguins dataset with missing values penguins_most_frequent <- penguins # Replace missing values with the most frequent value in each column for (col in c("bill_length_mm", "bill_depth_mm", "flipper_length_mm")) { most_frequent_value <- table(penguins_most_frequent[[col]])[which.max(table(penguins_most_frequent[[col]]))] penguins_most_frequent[is.na(penguins_most_frequent[[col]]), col] <- most_frequent_value } # Check the dataset with imputed values head(penguins_most_frequent)The above code assigns the most frequent value of the column to the missing value, A loop is used for iteration of each column. col is the loop variable
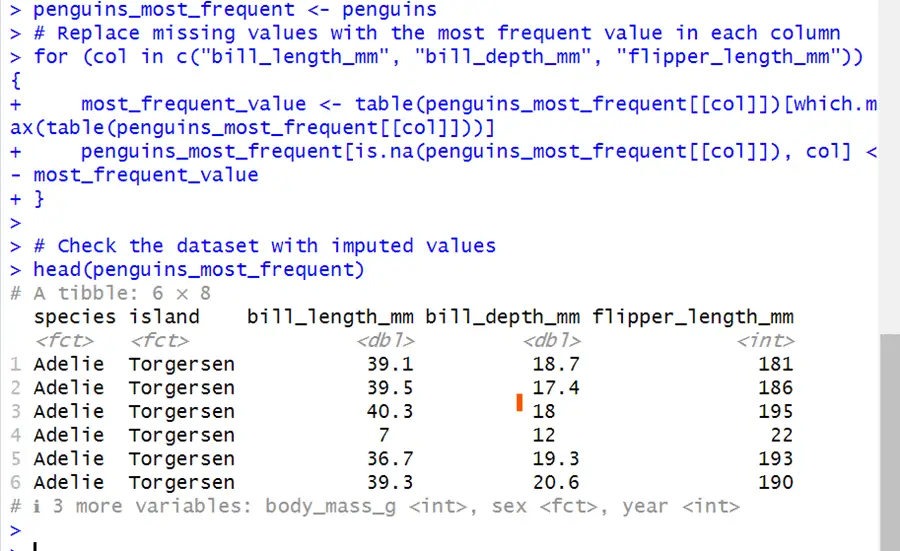
Thus, missing values are covered with the maximum value of the columns.