
Data Visualizaiton of Numerical Variable Using ggplot2 | ggplot part 3
Dec 22, 2023

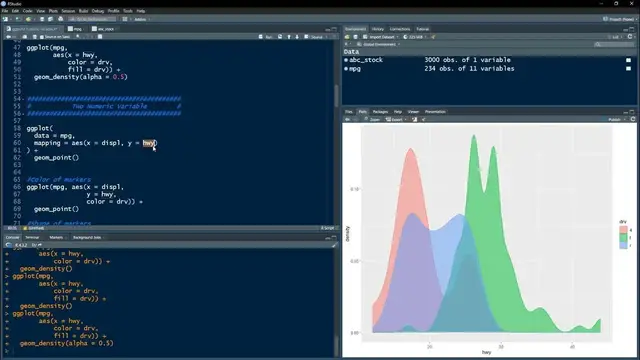
In this video we have covered the visualizaiton of numerical varaible. We discuss box plot, scatter plot, line plot and histogram. Histogram can be used when we have a single numerical variable and we would like to look at its distribution. Where as scatter plot can be used to understand the relationship between two numerical variables.
The following link contains the files used in this video
https://payhip.com/b/0Q2jO
Website: thedatahall.com
As an Amazon Associate, I earn from qualifying purchases.
Show More Show Less