
thedatahall.com

186 Videos
Numbers are hard to interpret specially if they are not presented well. See more
Popular
play_arrow
18:17
play_arrow
11:48
play_arrow
8:57
Standardization and Normalization in Stata
May 16, 2024
play_arrow
22:28
Working With Dates in Stata
Mar 19, 2023
play_arrow
5:00
play_arrow
20:08
play_arrow
14:52
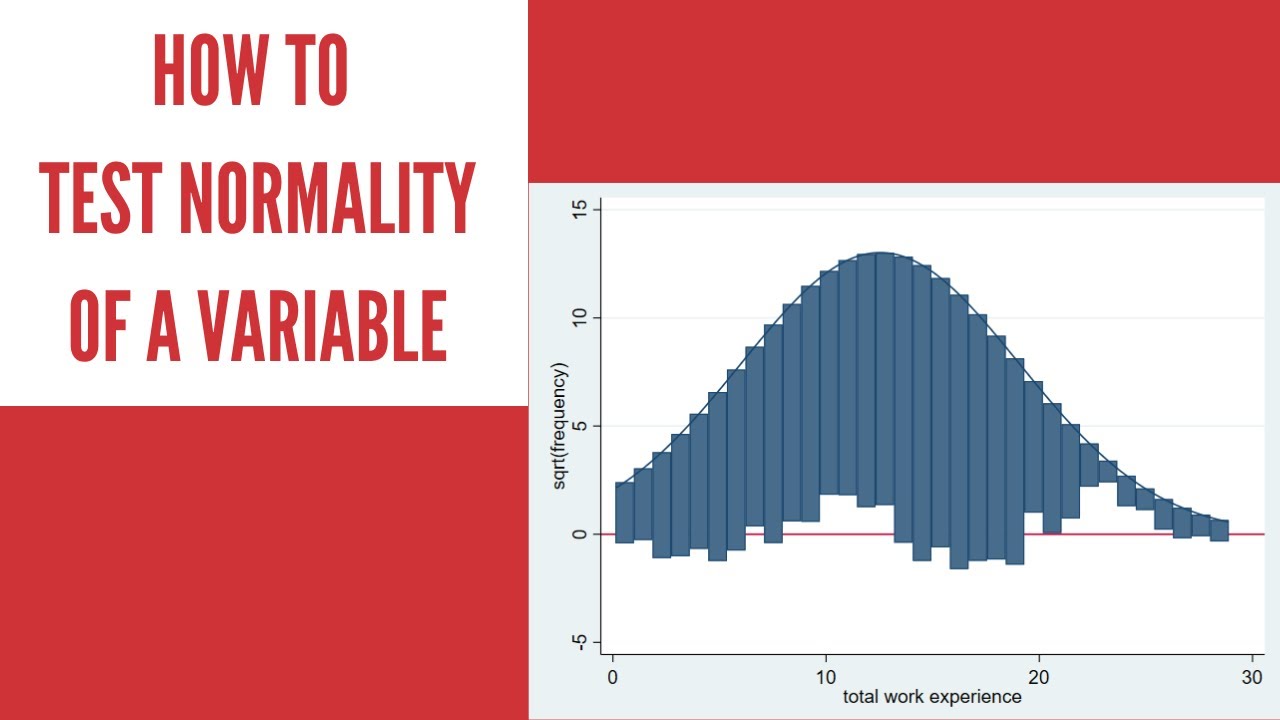
play_arrow
15:31
play_arrow
11:14
Calculate Portfolio Return in R
May 16, 2024
Favorites

play_arrow
18:17

play_arrow
11:48

play_arrow
8:57
Standardization and Normalization in Stata
May 16, 2024

play_arrow
22:28
Working With Dates in Stata
Mar 19, 2023

play_arrow
5:00

play_arrow
20:08

play_arrow
14:52

play_arrow
15:31

play_arrow
11:14
Calculate Portfolio Return in R
May 16, 2024
Just Added
play_arrow
6:53
How to Check Normality of a Variable in R
May 16, 2024
play_arrow
16:08
play_arrow
4:54
Standardization and Normalization in R
May 16, 2024
play_arrow
11:11
Margins and Margins Plot in Stata
May 16, 2024

play_arrow
8:57
Standardization and Normalization in Stata
May 16, 2024
play_arrow
10:35
Categorical Variable Regression in R | Part1
May 16, 2024
play_arrow
11:27
Categorical Variable Regression in R Part2
May 16, 2024

play_arrow
10:02
Two-way interaction Using R Part4
May 16, 2024
play_arrow
9:23
Explore More
play_arrow
4:55
Download Stock Data in R
May 16, 2024
play_arrow
5:09
Generate Sample Data in R
May 16, 2024
play_arrow
8:03
Working With Missing Values in R
May 16, 2024
play_arrow
7:36
Fill Gaps in Time Series and Panel Data in R
May 16, 2024

play_arrow
14:12
Three Way Interaction in R | The Data Hall
May 16, 2024
play_arrow
5:39
Fama and French Five Factor Model in Stata
May 16, 2024
play_arrow
14:00
Delete Duplicate Observations in R
May 16, 2024
play_arrow
22:32
play_arrow
10:47

play_arrow
16:08

play_arrow
6:53
How to Check Normality of a Variable in R
May 16, 2024

play_arrow
4:54
Standardization and Normalization in R
May 16, 2024

play_arrow
11:11
Margins and Margins Plot in Stata
May 16, 2024

play_arrow
8:57
Standardization and Normalization in Stata
May 16, 2024

play_arrow
10:35
Categorical Variable Regression in R | Part1
May 16, 2024

play_arrow
11:27
Categorical Variable Regression in R Part2
May 16, 2024

play_arrow
10:02
Two-way interaction Using R Part4
May 16, 2024

play_arrow
9:23

play_arrow
4:55
Download Stock Data in R
May 16, 2024

play_arrow
5:09
Generate Sample Data in R
May 16, 2024

play_arrow
8:03
Working With Missing Values in R
May 16, 2024

play_arrow
7:36
Fill Gaps in Time Series and Panel Data in R
May 16, 2024

play_arrow
14:12
Three Way Interaction in R | The Data Hall
May 16, 2024

play_arrow
5:39
Fama and French Five Factor Model in Stata
May 16, 2024

play_arrow
14:00
Delete Duplicate Observations in R
May 16, 2024

play_arrow
10:47

play_arrow
22:32
video_library
No shorts created yet for this channel.
video_library
No playlists available for this channel.
