
ANOVA (Analysis of Variance) is an analysis tool used to see the effect of categorical independent variables on a dependent variable in regressions. This article is motivated by Chapter 9 of A Gentle Introduction to Stata by Alan C. Acock.
There are two main assumptions that need to be met when using ANOVA.
- The groups in a categorical variable must be independent.
- Data must be normally distributed with equal variance.
To explore how to perform ANOVA in Stata, we will use Stata’s reading scores dataset (‘reading.dta’). This dataset can be loaded using the webuse command.
webuse reading.dta
This dataset has five variables related to students’ reading scores, reading program, skill enhancement technique, and their group.
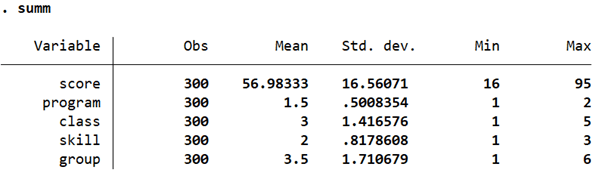
We will drop the ‘class’ and ‘group’ variable and use only the ‘program’ and ‘skill’ variables as the independent categorical variables that have an effect on ‘score’.
drop class group
Checking Normality of Dependent Variable in Stata
Related Article: How To Check Normality of a Variable In Stata
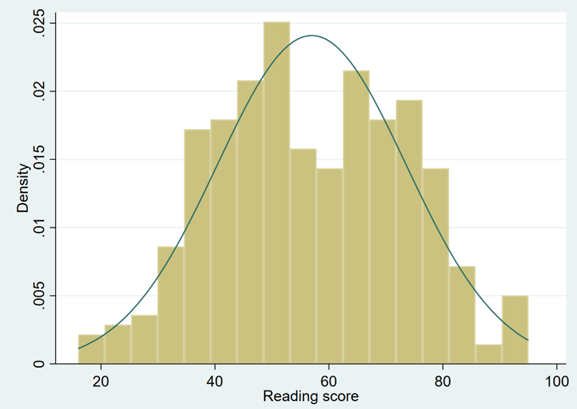
First, let’s check whether ‘score’ is normally distributed or not. While there are several ways to do this, we will use a simple histogram.
histogram score
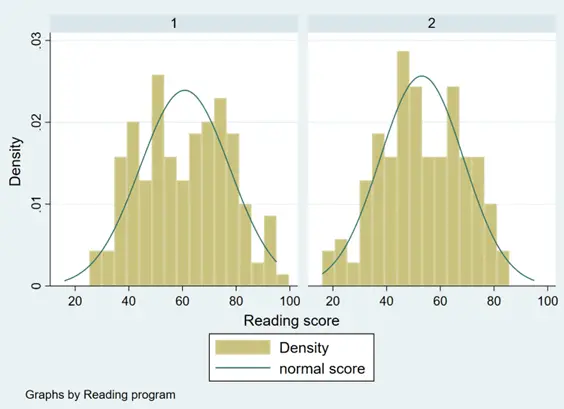
histogram score, by(program) normal
histogram score, by(skill) normal
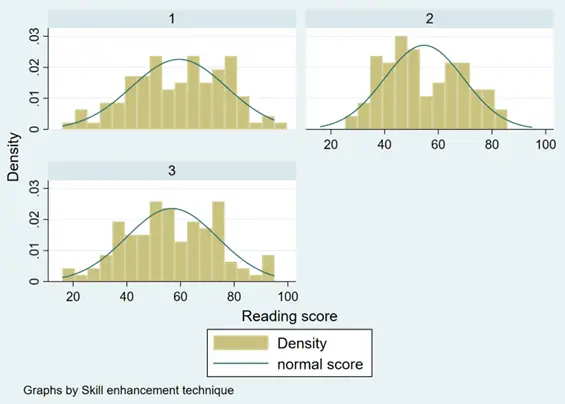
In general, the variable ‘score’ does appear to tend to follow a normal distribution across all groups of the categorical variables.
Types of ANOVA
There are two main types of ANOVA:
- One-way (or unidirectional) ANOVA
- Two-way ANOVA
A one-way ANOVA helps evaluate the effect of a single, categorical independent variable on a single dependent variable. It can be used to see whether there exist any statistically significant differences between the means of the independent (unrelated) groups/categories.
A two-way ANOVA is similar to a one-way ANOVA, with the only difference being that there are two categorical, independent variables. A two-way ANOVA is also used to study the interaction between the two categorical variables. Similarly, it can also used to study their joint effect on the dependent variable.
The Null Hypothesis in ANOVA in Stata
The null hypothesis in an ANOVA test states that there is no statistically significant difference between the groups/categories being tested. In other words, the null hypothesis states that the means of all these groups are equal If this is true, the ANOVA test’s F-ratio statistic will be close to 1.
The alternative hypothesis would be that the mean of at least one of the groups/categories is not equal to the others.
Related Article: Correlation Analysis in Stata (Pearson, Spearman, Listwise, Casewise, Pairwise)
One-way ANOVA in Stata
Let’s conduct a one-way ANOVA using ‘score’ (i.e. a student’s reading score) as the continuous, dependent variable and ‘program’ as the independent categorical variable. A one-way ANOVA can be performed in Stata using the oneway command followed by the dependent and the independent variables.
oneway score program, tab
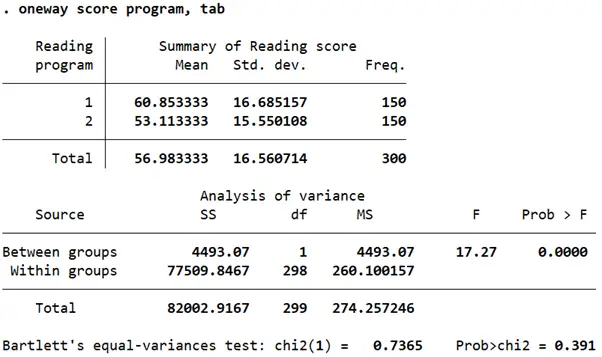
The table reports the sums of squares (column ‘SS’), the means of squares (MS) along with the degrees of freedom (df). The mean squares is calculated by dividing the sums of square by the degree of freedom. The relevant test statistic in this case is the F-stat reported in the second last column titled ‘F’ calculated by taking a ratio of the mean squares. The degrees of freedom in the numerator are 1, and in the denominator are 298.
Statistical significance of the F-stat can be ascertained from the p-value (column titled Prob > F). If the value is less than 0.05, we can say that at least one pair of means is not equal.
In this case, because the p-value is 0, it can be concluded that at least one pair of score means across the two groups of the reading program are not equal.
The Bartlett’s test for equal variance is reported at the bottom. Because the p-value (prob>chi2) is statistically insignificant, it suggests that the variances of the mean score across the groups are not unequal.
So, which of the pairs of means is not equal then? We can check this by reporting all possible pairwise comparisons using the Bonferroni correction.
oneway score program, tab bonferroni
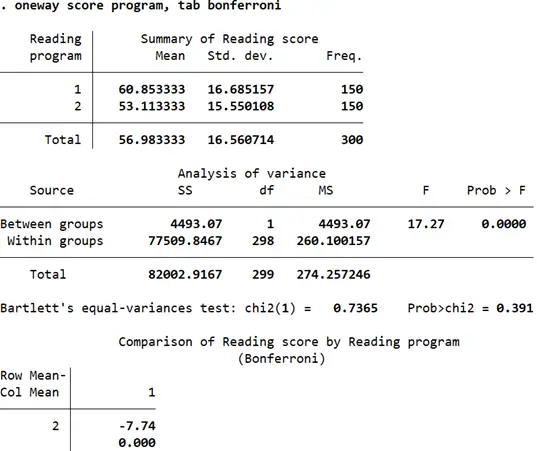
The Bonferroni correction reports the pairwise comparisons of means while also adjusting for multiple comparisons. The table at the bottom displays two statistics for each pair of means. The first statistic (-7.74) is the difference of the row mean and the column mean (i.e. the difference between reading scores in program 2 and reading scores in program 1). Below this is the p-value for the comparison that has already been adjusted for multiple comparisons by Stata. Wherever the p-value is less than 0.05, we can conclude that those pairs of means are not equal. In this case, the difference of -7.74 is statistically significant and the difference in mean reading scores across both program groups can be concluded to be unequal.
If the independent variable had more than two categories, the pairwise mean differences between them would also be reported.
This exact one-way analysis of variance can be done using the ANOVA and the regress command together.
anova score program
regress, baselevels
The coefficient reported from the regress command is interpreted by treating it as a difference compared to the base category. In this case, program 1 is the base category. Reading scores of students in program 2 tend to be 7.74 points lower than program 1 student. This difference is also statistically significant (p-value = 0.000 < 0.05).
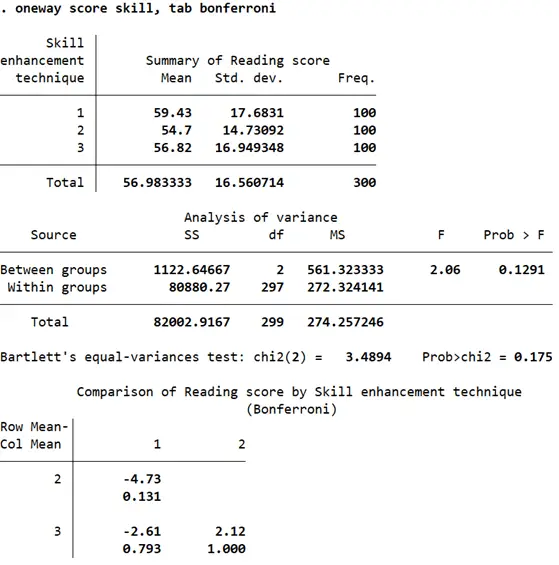
Let’s also do a one-way ANOVA in Stata on the effect of ‘skill’ on ‘score’.
Related Article: Using different types of t-test in stata
The F-stat in this case has a p-value of 0.1291 which is much higher than our significance level of 0.05. This leads us to conclude that across the three categories of skill enhancement techniques, reading scores do not differ significantly. The pairwise comparisons reported in the second table are not very large, and all have a p-value of of over 0.05 indicating that reading scores of students that were subject to skill enhancement technique 1 are not different from those subject to skill enhancement technique 2 which in turn is also not significantly different from reading scores of students from skill enhancement technique 3.
Two-way ANOVA in Stata
A two-way ANOVA test is used when we want to check whether our (continuous) dependent variable differs significantly over two independent categorical variables. We can also check whether there is an interaction effect of the two independent variables on the dependent variable. Let’s check whether ‘score’ differs across ‘skill’ and ‘program’ together.
anova reading program##skill
The two hash signs indicate that we would also like to study the joint effect of the two variables on ‘reading’.
This is a quicker way of writing the following command which will also produce the exact same output.
anova reading program skill program#skill
The order in which the independent variables are specified does not matter.
It also does not matter if the data is balanced or not. Data is balanced if there are an equal number of observations for all the pairs of categories that can be present when interacting the two independent variables. This can be checked through a simple tab command.
tab skill program
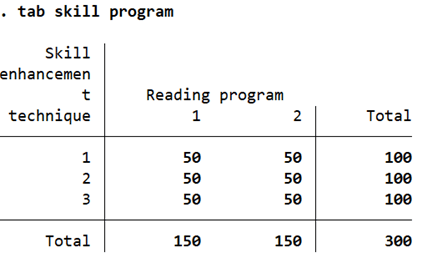
In this case, our data is balanced because the number of observations for each possible interaction/pair of the categorical variables is equal at 50. If they were unequal, there would be an unequal number of observations for the program-skill cells here, but that would not have affected Stata’s two-way ANOVA execution.
Let’s run the two-way ANOVA.
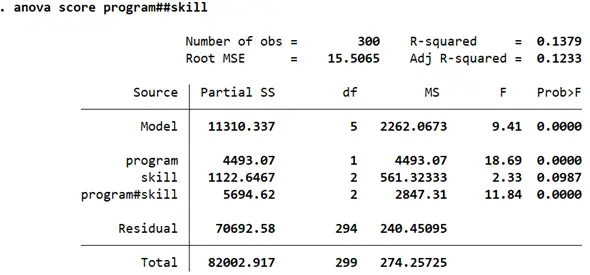
The F-stats and their p-values reported for ‘program’ and ‘skill’ allow us to draw the same conclusions about the effect of the categories on ‘score’. The different categories in ‘program’ have a statistically different effect on reading scores, while the three skill techniques in ‘skill’ do not appear to be associated with statistically significant differences in reading scores. The interaction of these two variables, i.e. the joint effect of ‘program’ and ‘skill’ does appear to be statistically significant as indicated by a p-value of 0.000 with an F-stat of 11.84.
Let’s look at the regression coefficients for each pair of categories across the two groups. This time, we use the option allbaselevels so it is clear which pairs of categories the coefficients are to be compared against. This is helpful when there are more than two categories in a variable which is being interacted with another.
regress, allbaselevels
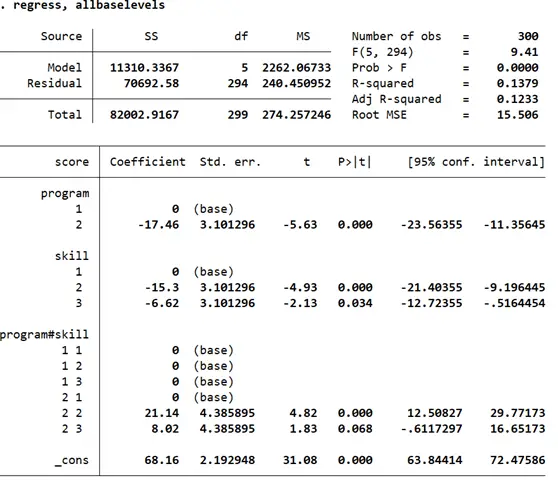
The coefficient for category 2 of ‘program’ shows the same result as the one we found using one-way ANOVA. For the variable ‘skill’, we find that the mean reading scores in category 2 and category 3 differ significantly from the base category 1 (by being 15.3 points and 6.62 points lower respectively) once the joint effect of ‘program’ and ‘skill’ is accounted for.
The interaction effect of these two independent variables, when broken down, suggests that when a student is part of program 2 and skill enhancement technique 2, their reading score tends to be higher by 21.14 points as compared to the four base categories.